Get my FREE cheat sheets for Statistics and Research Methods (including transcripts of these lessons) here: www.learnmore365.com/courses/statistics-research-methods-resource-library
So glad to have found you as I am sure many others are. I wish I had found you before I trudged through the dull micro-lectures provided for my online University masters degree. You make the subject relative and understandable. I am going to watch everything. I need to. Thank you!
Hi Greg! Thanks for the great videos. I am trying to figure out how to filter out outliers and then run a linear model, but am getting stuck. Any suggestions?
Remarkable lecture, thank you so much. Q. Please share me/us a video lecture of multiple regression plot with confidence interval and annotation of the equation and significant level?
Thanks for all you do, Greg. Please I have a quick question. Please which result should I rely on (the lm or t-test) if I get the effect of the independent variable with lm but the value of p value is not less than 0.05 when I compare them with the t-test using the same data. Thanks
Hello, Im not Gret but heres my 2 cents. Linear regressions and t-student tests look for different things. T-student is used to see if the mean is different between 2 groups or after an intervention. For example you could use t student to test for differences in height between boys and girls, or between children and adults. You are not trying to establish a relationship, just a difference. And inherently, your data is composed of a continous variable and another for grouping. In essence you use when you want to know IF theres a difference. Linear regressions quantify the relation between two continous variables. In this case you could use it to see if theres a relation between age and height, but notice how both age and height are continous variables. In this case you wouldnt use a lm to know if theyre different, but to track how the change in one affects the other. Hope it helps and open to feedback if its a wrong take.


Get my FREE cheat sheets for Statistics and Research Methods (including transcripts of these lessons) here: www.learnmore365.com/courses/statistics-research-methods-resource-library
So glad to have found you as I am sure many others are. I wish I had found you before I trudged through the dull micro-lectures provided for my online University masters degree. You make the subject relative and understandable. I am going to watch everything. I need to. Thank you!
I'm thrilled to hear that you've found the content helpful and engaging! It's always my goal to make learning as accessible and enjoyable as possible.
Awesome job as always. Thank you for all you contribute to stats knowledge.
You're welcome! Glad you enjoyed it!
Hi Greg! Thanks for the great videos. I am trying to figure out how to filter out outliers and then run a linear model, but am getting stuck. Any suggestions?
Thanks for the video, Greg. Please could you do a video on the assumptions of linear regression as a sequel to this video. Thanks
Will do
Hi, for multiple linear regression, can a percentage change (a reduction) in the level of say blood glucose, be the continuous dependent variable?
Did anyone finde that cheat sheet Greg mentions at the end of the video?
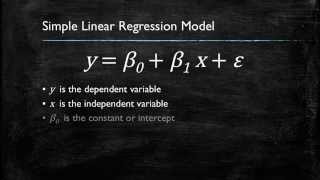
If the y-intercept is meaningless, then the line can be anywhere along the y-axis. If so, then how it will predict y for an unseen x?
Remarkable lecture, thank you so much.
Q. Please share me/us a video lecture of multiple regression plot with confidence interval and annotation of the equation and significant level?
Hi Greg. Your videos are awesome. Do you have one explaining how to perform multiple logistic regression in R?
Thank you for your feedback and suggestion
good explanation
Thanks
Thanks for all you do, Greg. Please I have a quick question. Please which result should I rely on (the lm or t-test) if I get the effect of the independent variable with lm but the value of p value is not less than 0.05 when I compare them with the t-test using the same data. Thanks
Hello, Im not Gret but heres my 2 cents. Linear regressions and t-student tests look for different things. T-student is used to see if the mean is different between 2 groups or after an intervention. For example you could use t student to test for differences in height between boys and girls, or between children and adults. You are not trying to establish a relationship, just a difference. And inherently, your data is composed of a continous variable and another for grouping. In essence you use when you want to know IF theres a difference. Linear regressions quantify the relation between two continous variables. In this case you could use it to see if theres a relation between age and height, but notice how both age and height are continous variables. In this case you wouldnt use a lm to know if theyre different, but to track how the change in one affects the other.
Hope it helps and open to feedback if its a wrong take.
Thanks Dr. This is helpful!
Amazing!!
Thanks!!
first comment to say thanks from the heart
Much appreciated Max !!
Enjoying your content on both the channel: R Programming 101 and Global Health with Greg Martin. Thank you.
Thanks for the feedback. Much appreciated. Glad you like the content. Gonna start a new channel on AI and Health too soon. Watch this space.
@@gregmartin sure.
Awesome
Thanks.
meddl loide
Meddl