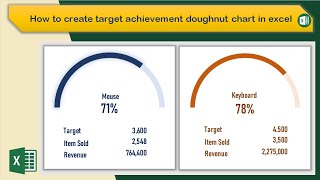
Dynamic Sales Cost and Profit Dashboard in Excel

ฝัง
- เผยแพร่เมื่อ 25 ก.ย. 2024
- In this video, we’ll guide you through creating a powerful Sales Cost and Profit Dashboard in Excel. Learn how to visualize your sales data dynamically, track costs, and analyze profit margins-all in one easy-to-navigate interface. Perfect for beginners and seasoned pros alike, we’ll cover essential Excel functions, data visualization techniques, and tips to streamline your reporting process. Don’t miss out on transforming your sales analytics!
👉 Watch now and take your data skills to the next level!
Data Set: shorturl.at/RYoit


PLEASE PROVIDE DATA SET AS WELL AS
please find link in description.
Please share the dataset with us. Thank you
please find link in description.
SIR KINDLY SHARE DATASET FILE PLEASE
PRACTICE K LIAY ZAROORI HY PLEASE
please find link in description.
acha kiya tune toh ye dashboard