boxplot for comparison | before and after| group cross group comparison| ggplot2| R

ฝัง
- เผยแพร่เมื่อ 3 ธ.ค. 2021
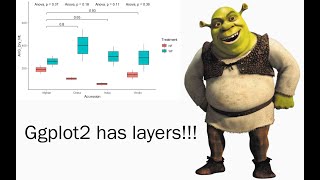
- In this video, you will be able to create a boxplot within-group and cross-group comparisons. I often make sure that you can access the same dataset as in my video and I also upload the full R code that I used in my video. I hope you find them helpful and let me know if you have any comments or questions.
0:30 the kind of data
1:55 use ggplot
3:55 change factor levels
4:45 change colors of boxes
The dataset I used in this video is here (a data set I used some random numbers): github.com/yz-DataScience/R-f...
The R code for this video is here: github.com/yz-DataScience/R-f...
Code together with me as you watch the video. I believe you will get exactly the same graph as I did.
Special thanks to my biologist friend who asked me to help her create this kind of graph and I found it to be a super useful graphic tool.


Hi I'm Morrel Mr/Dr. Morrel and my Chinese name is Dalong:)! This is my first time to talk about me/myself here. I'm not a fan of anyone here, but I can say your videos or teaching are more better than others. Maybe some people were born for teaching. I also know much that in China the people love teaching job or to be a teacher. In constrast, to our homeland (Generally speaking). There are people who were intelligent during their studies, but there aren't good at teaching and others were average and they became good at teaching. According our homeland I wasn't like teaching at the beginning (B.S+M.S), (when I was student) and at the end when the government employed me, I started to teach and pupils/students loved me. Brief, it is a very good job (Teachers or profs. learn a lot in teaching). So, for this video, let me watch it and ask question(s) if I have. Thank you!
Excellent series. Very clear . Do continue the series to complete the text.
Thanks! I’ll try to make time for more videos!
thanks for your suport
Very good content 👏🏻
Thanks!
I followed the steps, very practical, unfortunately in the graphic area instead of groupped boxplots it appears groups of minus (features) in mine
In order to find what I made you may send me your second or third e-mail. PLZ. To enter into it and see it you may convert it to Internet explorer after receiving it. Still not make it in the way you did. I need a hand. Thank you!
Sorry, except R software we downloaded, we also need to download ggplot (ggplot2) before running, right?
If it was possible to paste or add here I'll do it. I mean that I'll show up my error or maybe my r software is missing something
How you make a video for same example using repeated measure anova
Good demonstration. But, I could not find the boxplots inside the graphic, I only find the legend (stage). Instead of boxplots, it appeared lines. I do not know what the hell is that
If you copy my r code In the description, it might help
Error in install.packages : Updating loaded packages
> ggplot(crab_data,aes(x=species,y=weight,fill=stage))+
+ geom_boxplot()
Error in ggplot(crab_data, aes(x = species, y = weight, fill = stage)) :
could not find function "ggplot"
> ggplot(crab_data,aes(x=species,y=weight,fill=stage))+
+ geom_boxplot()
Error in ggplot(crab_data, aes(x = species, y = weight, fill = stage)) :
could not find function "ggplot"
Download the latest version
Rstudio, R 4.2.3
Thanks a lot..
As a side question:
what is the difference between is.factor and factor ?
factor is to change it into factor levels; is.factor is a logic check, it will return true or false results.
Could you zoom the raw data? PLZ.
I tried to follow You unfortunately my boxplot it appears minus or dash
Can you paste your r code so I can take a look?
I wonder whether another thing or software is missing. Many thx
Please paste your R code here so I can take a look
Excuse me, what code you mean? The procedure?
The R code I wrote while recording this video is here: github.com/yz-DataScience/R-for-data-science/blob/main/boxplot_for_comparison.R
@@datasciencewithyan4124 Seems to be difficult for beginners/leraners
This is truly a little advanced!
Mine: Error in library(readx1)
The best way is to follow my instruction and import the dataset from your computer. If you want to type it out, it is library(readxl). The last one thing is letter l not number 1
@@datasciencewithyan4124 Thank you for clarifying me:)!
Mine it still appears like this: _ _ _ _ _ _, only legend appeared well
Perhaps, if I may have an email address I will save what I done and sent it to You. Thank you!
Sorry , can't follow, because I don't the data well