I already have my education in finance but I enjoy crafting retirement calculators to keep my skills sharp. The ONE area that has eluded me has been MC analysis and you are the first person to present it in a clear, easy to understand format! Also, a tip I came across from my work is using CTRL+SHIFT+Down Arrow will automatically select all your data and nothing more. CTRL+D will fill the selected formula all the way to the bottom. Here's hoping someone gets a little use out of it!
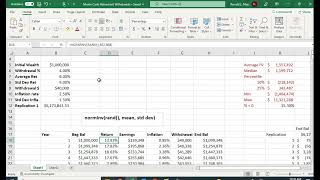
This is very insightful and helpful. Could you explain whether the future value in this example would more likely be the average (around $5.7 million) or the median ($4.6 million +/-) and why?
I have come across a research paper in which they have developed regression models using past data (uptil 2016). The pdfs of variables were already known from literature review. For 2017 onwards, they utilized the forecasted values as the mean of the distribution and took 10% of that mean as standard deviation for each year, and performed MCS to calculate annual uncertainty. Is there any relation or basis for taking 10% of mean as SD for future uncertainty analysis? I have analyzed the past data as well SD is nowhere near 10% of the mean value.
Hoping someone answers as posting is older. Can you, instead of using 10K per year of savings use 10K per year spend down (- sign for that cell instead of + sign)?
Can you do another one with showing examples of distributions. Not just accumulations. Thank you for the excel. I have been trying to create this for awhile.
Enjoyable video for Monte Carlo Sim example. For savings growth, wouldn't you need an interest rate model rather than a normal distribution assumption?
Using a normal distribution to estimate stock returns is from wjat I hear a bad idea, amd results in am overly optimistic result. A different distribution is mkre accurate
Thanks for the video! Just wondering, how do you handle the occasional simulated return of less than -100%? particularly for assets that might have higher standard deviations? Occasionally, I'm getting a simulation trial where a year's return just flips the sign of the total portfolio. I feel like the portfolio shouldn't be able to lose more than 100% of it's value.
excellent lecture 👍 this video actually helped me finally understand monte carlo now, whereas before I never really understood it when going through the CFA L1 or Mark Meldrum content i really like the retirement savings example you used too 😃


I already have my education in finance but I enjoy crafting retirement calculators to keep my skills sharp. The ONE area that has eluded me has been MC analysis and you are the first person to present it in a clear, easy to understand format!
Also, a tip I came across from my work is using CTRL+SHIFT+Down Arrow will automatically select all your data and nothing more. CTRL+D will fill the selected formula all the way to the bottom. Here's hoping someone gets a little use out of it!
Thanks for the tip!
Very nice explanation, I have finally understood it for a lifetime.
Very clear, simple, and practical explanation, thank you I was able to make this myself watching the video!
Very well explained with great clarity. Really respect your work 😊
Very useful simulation and clear presentation using Excel
Excellent video. Thanks for sharing 👍
fantastic tutorial! very useful and applicable to everyone.
This is very insightful and helpful. Could you explain whether the future value in this example would more likely be the average (around $5.7 million) or the median ($4.6 million +/-) and why?
Very helpful video, thank you so much for your time and effort!
New to you tube. Not sure if I can download the spreadsheet so I can play with my numbers,
What is the relationship between the standard deviation of ave return (originally 12%) and the standard deviation of the final end value?
Nice exaplanation. Guess the standard deviation should be 2% since it's assumed to hovering anywhere around +/-2% std deviation of 10%.
I love this guy! Great tutorial.
I have come across a research paper in which they have developed regression models using past data (uptil 2016). The pdfs of variables were already known from literature review. For 2017 onwards, they utilized the forecasted values as the mean of the distribution and took 10% of that mean as standard deviation for each year, and performed MCS to calculate annual uncertainty. Is there any relation or basis for taking 10% of mean as SD for future uncertainty analysis? I have analyzed the past data as well SD is nowhere near 10% of the mean value.
Hoping someone answers as posting is older. Can you, instead of using 10K per year of savings use 10K per year spend down (- sign for that cell instead of + sign)?
This is full of great excel tips, but I am not sure of the applicability to retirement planning.
Can you do another one with showing examples of distributions. Not just accumulations. Thank you for the excel. I have been trying to create this for awhile.
Enjoyable video for Monte Carlo Sim example. For savings growth, wouldn't you need an interest rate model rather than a normal distribution assumption?
Using a normal distribution to estimate stock returns is from wjat I hear a bad idea, amd results in am overly optimistic result. A different distribution is mkre accurate
I think when you copied the cell from the 10% to the 25% the array "H14:H1013" didn't copy correctly, I bet the 25% has "H15:H1014".
Yes
Sir,
How to Simulate to identified Trading Drawdown values for knowing Risk
Very useful. Thank you!
Thanks for the video! Just wondering, how do you handle the occasional simulated return of less than -100%? particularly for assets that might have higher standard deviations? Occasionally, I'm getting a simulation trial where a year's return just flips the sign of the total portfolio. I feel like the portfolio shouldn't be able to lose more than 100% of it's value.
Great video
excellent lecture 👍 this video actually helped me finally understand monte carlo now, whereas before I never really understood it when going through the CFA L1 or Mark Meldrum content
i really like the retirement savings example you used too 😃
loved this video
Thank you! 😊
Thank you!