Stock Portfolio Monte Carlo Simulation In Excel

ฝัง
- เผยแพร่เมื่อ 17 มิ.ย. 2024
- Ryan O'Connell, CFA, FRM shows how to build a Stock Portfolio Monte Carlo Simulation In Excel.
👨💼 Freelance Financial Modeling Services:
► Custom financial modeling solutions tailored for your needs: ryanoconnellfinance.com/freelance-finance-services/
🎓 Tutor With Me: 1-On-1 Video Call Sessions Available
► Join me for personalized finance tutoring tailored to your goals: ryanoconnellfinance.com/finance-tutoring/
💾 Download Free Excel File:
► Grab the file from this video here: ryanoconnellfinance.com/produ...
Chapters:
0:00 - Define Assumptions About S&P 500 Index
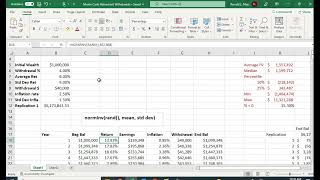
0:50 - Calculate the Ending Value of the Portfolio
2:30 - Create Monte Carlo Simulation Using Data Table in Excel
4:06 - Calculate Stock Portfolio Summary Statistics
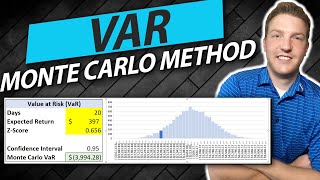
6:28 - Create a Histogram of the Monte Carlo Simulation Results
*Disclosure: This is not financial advice and should not be taken as such. The information contained in this video is an opinion. Some of the information could be wrong. This channel is owned and operated by Portfolio Constructs LLC


![[Full Episode] MasterChef Junior Thailand มาสเตอร์เชฟ จูเนียร์ ประเทศไทย Season 3 Episode 3](http://i.ytimg.com/vi/A1XXYbV048k/mqdefault.jpg)


👨💼 Freelance Financial Modeling Services:
► Custom financial modeling solutions tailored for your needs: ryanoconnellfinance.com/freelance-finance-services/
💾 Download Free Excel File:
► Grab the file from this video here: ryanoconnellfinance.com/product/stock-portfolio-monte-carlo-simulation-excel-spreadsheet/
Just learning about Monte Carlo Simulations and this is a very good example!
Thank you Richard!
remarkable!👏
Thank you for share Ryan. Another interesting topic.
You are very welcome and I'm glad you enjoyed it William
Very interesting, thanks. I love Monte Carlo simulations.
Keep up the good work! 👍
Glad you enjoy it and there are more to come!
Thank you so much sir, it helped me a lot.
You are most welcome
Hello,
Can you explain why we use the norm.inv formula, and why is it more relevant than simply using the random variable ?
Thanks
beautifully explained.
Thank you!
Hey Ryan thnak you so much for rour interesting videos on VaR, can you please do a video on how to calculate a stressed VaR i've been looking for it in youtube for a good time and nobody explain how to implememt it. thank u so much
Good suggestion, I'll look into that in the future!
Wow, amazing tool and description. Thank you.
.
Investigation into mean-variance of portfolio asset allocation led me here. Where could I find a definitive source of (historical) means and standard deviations of various allocation % across asset classes?
.
I'm thinking I could plug in those figures for each asset allocation choice into the spreadsheet to get a feel for which allocation breakdown(s) are best suited for me.
Thank you!
You can Google your inquiry and there are a number of different studies that come up. They will differ based on the time periods used. I don't feel comfortable calling any of them the definitive source.
You can also just calculate these values yourself using ETFs or indexes as proxies
🔥
Thanks for the video! Question: how do you account for portfolios that might have a much higher standard deviation such that you might randomly simulate returns of less than -100% (losing more than principle)
I think you could use an IF function in excel to wrap around the value and essentially say that if the loss goes below -100% it will just be -100%
Thank you for the share. Excellent video and chart. One question.. It seems to be set for 40 years. What if I need to do only 30 years. I do not see that option. If I delete the last 10 years the chart does not function.
My pleasure! You would need to update any formulas that have the range of data in them so that you are not breaking any formulas
The chart's y axis should be whole number representing number of iterations rather than currency.
Good catch on that one hugh
What can you do about equity research (buy, hold, sell) on monte carlo
Monte Carlo simulations can be super helpful for stock analysis! Just create a model using historical data, financial ratios, and other factors. Run the simulations, check the risk-reward balance, and see how it fits your investment goals. Then, decide whether to buy, hold, or sell. Just remember, these simulations have their limits, so don't forget to do some extra research and seek professional advice
I have come across a research paper in which they have developed regression models using past data (uptil 2016). The pdfs of variables were already known from literature review. For 2017 onwards, they utilized the forecasted values as the mean of the distribution and took 10% of that mean as standard deviation for each year, and performed MCS to calculate annual uncertainty. Is there any relation or basis for taking 10% of mean as SD for future uncertainty analysis? I have analyzed the past data as well SD is nowhere near 10% of the mean value.
That is really strange to me and I can't intuitively figure out why they would use 10% of the mean as standard deviation off the top of my head. That doesn't make sense to me but maybe there is something we are both overlooking
@@RyanOConnellCFA could you kindly provide me with your email or any other medium where I could share the paper with you along with my working?
What is the main reason we would use a monte carlo simulation? If we can just do the math (Return * n) - zscore*(sqr(n)*standard deviation) for investment returns why would we use the simulation? It makes sense in this use case because it was by far quicker to use the simulation than to do the math by hand, but if there is a use case where doing the math by hand is relatively easy would we want to use Monte Carlo?
Great question! While mathematical models can be very effective, they often assume a normal distribution and constant volatility, which may not accurately reflect the real-world complexity of financial markets. Monte Carlo simulations offer a way to model random variables with different types of uncertainty, and they allow us to account for events that might not be considered in traditional mathematical models, such as rare events with significant impacts (i.e., black swan events).
Simulations can also take into account the potential dependencies and interactions among multiple variables, which could be hard to incorporate into a simple equation. Therefore, even if the math might be easier or faster to compute in some cases, a Monte Carlo simulation can provide a more realistic, detailed, and nuanced view of potential outcomes. However, as always, the choice between a simulation and a mathematical model depends on the specific circumstances and the level of complexity you're comfortable with.
Hi Ryan what is the time horizon for this simulation?
@2:16 it can be seen that the time period for this simulation is 40 years
Hi Ryan can the Markov transition matrix apply to this?
Hello, yes, a Markov transition matrix can be applied to a stock portfolio Monte Carlo simulation in Excel to model the probabilities of different market states and their impacts on portfolio returns
@@RyanOConnellCFA do you mind making an example video? Please 😁
can you combine this with solver?
If you're looking to find an optimal portfolio using the solver then check out this video: th-cam.com/video/XQS17YrZvEs/w-d-xo.html
At 6:59 you should not change the y-axis to dollars - it's a (dimensionless) count of how many trials ended up in each bin. Dollar value is on the x-axis.
Good point, that should have just stayed numerical!