Basic Monte Carlo Simulation of a Stock Portfolio in Excel

ฝัง
- เผยแพร่เมื่อ 26 ก.ย. 2024
- Please SUBSCRIBE:
www.youtube.co...
alphabench.com...
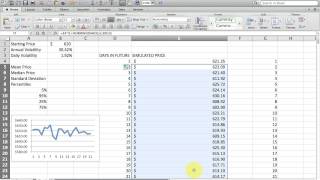
Demonstration of a simple Monte Carlo simulation technique or Monte Carlo method that utilizes the Excel Data Table feature to replicate iterations. This tutorial models annual investments in an S&P 500-like environment. No add-ins are used; 100% pure Excel. Monte Carlo simulation in Excel typically makes use of add-in software for Excel like Palisades Decision Suite or Oracle's Crystal Ball, but we can do a reasonable job modeling Monte Carlo Simulation with Excel, using just Excel.
Monte Carlo Simulation is one of the most highly used and important numerical techniques used in finance.
A dynamic histogram can be added to further characterize a return profile.
See my video on the topic:
• How to Make a Dynamic...
For a Monte Carlo simulation to approximate individual stock price movement see:
• How to Simulate Stock ...


One of the best and simple video about simulations I have ever seen, Thanks Matt
Thanks very much.
Even if the actual example is meaningless to you, the point is an excellent over all view of doing this with Excel to fit your need
Glad it helped
Matt is class apart. super underrated
Thank you. Glad it helped.
Column F has ending values in a specific year. Column B has ending portfolio values after 25 years, so they are more like potential values for B8.
Very nicely done.
Thank you. Glad it helped
You are awesome! This is an awesome simplification of the typically complicated monte carlo sim. So, thanks!
Thank you. Glad it helped
Great video, Matt. Thank you for taking the time to share and teach
Thanks. Glad it helped.
Very helpful video, Matt. Thank you!
Glad it helped
Great video, sir. I’m writing a thesis on VaR calculations through all methods and the way you simplified this one is brilliant. Thank you a lot.
Thanks very much. Glad it helped.
Matt Macarty Any plans of making the Markov Chain one ? Would be of great help ?
Best Explanation so far.......
Thanks very much. Glad it helped.
F9, or go to the formula tab and hit the calculate now button
beautifully explained and presented, thanks!
Thanks. Glad it helped.
very clear and concise. thank you very much!
Glad it helped
Wow thanks for the free education.
Glad it helped.
Thank you Matt. It was very helpful. Cheers!
Glad it helped
Thanks for such a nice exmaple
Glad it helped.
Very well explained, thanks!
Thanks, glad it helped
Explained Very well.
Glad it helped
Well, it's all relative. At least you can do it without expensive add-ins.
Super useful mate! Thanks.
Glad it helped
This is a purely theoretical example (in practice it's useless) so you need to warn people very clearly about this. I like that it's a crisp and easy video on running simulations in Excel. In the real world, though, how a person is prepared for and reacts to black swan events will matter more than what they did in the whole 30 years. Please work on modeling this instead of random returns with SDs. That should challenge you, Matt.
Thanks for the feedback. Yes, this is a demonstration on how to implement Monte Carlo, how you use it will depend on the modeler. Interestingly, when modeling ANNUAL returns there is only one year since 1871 where the return was less than 3 st dev from the mean, which I suppose one could characterize as a "black swan". What should one have done if they were invested? Probably nothing. It's like that old story about boiling a frog by putting them in cold water. How do you know you are being boiled if the water warms slowly? But what if you look at things more granularly, say daily returns. There is a really interesting post here about daily returns: www.thesimpledollar.com/investing/stocks/tempted-to-sell-missing-just-a-handful-of-the-best-stock-market-days-can-tank-your-returns/
You really helped me out, thank you.
Glad it helped
This video is very helpful. I am struggling with the click noises though. It would be great if it were captioned so I could turn off the sound.
Thanks for the feedback. Sorry about my keyboard abuse. It doesn't really help you, but I got a new microphone which seems to have solved the excessive keyboard sounds. You click "CC" in the lower right of the video for captioning.
thank for the video is very good, i am working with because i am making a work with real options
Glad it helped
Thanks for sharing, helped a lot!
Glad it helped
Thank you so much
Glad it helped
I did exactly the same, same numbers etc. but for 30 years, i did not get a mean around 4.3 millions every time, but rather a range form 1-7 million but nothing consistent at all
You can download my model here to compare: alphabench.com/data/monte-carlo-simulation-tutorial.html
Thank you
Glad it helped
@@MattMacarty I was able to replicate your steps easily thank you once again, can you please tell us how to do this in R
Really helpful, Thanks!
Glad it helped
Thanks, very helpful
Glad it helped
Glad it helped.
Hi it is an amazing video, may I just ask , why you chose in data table empty cell? This point I dont understand. Thank you!
Thanks. So that is kind of a workaround to get simulation iterations. By pointing at an empty cell as an input with no connection to the output you end up with the output being replicated. Since the output is based on a volatile function, every replication varies within the parameters established in the base model. This is just meant to introduce MC simulation. There are more sophisticated tools that do a better job of capturing a distribution, but they tend to be a little pricey.
If you are using Office 2007 or later, click the data tab, then what if analysis. If you are using an earlier version of Excel I believe the data table is found in the Data menu, and I am pretty sure it just has "table" as one of the options there (it's been a while since I used the menu driven interface).
Awesome Thanks! Any possibility of doing a multivariate demo? A simulation where both stocks and bonds could be analyzed? Would be great to see how the covariance between the two is modeled in a Monte Carlo Simulation.
Probably the best way to do this would be with a more advanced tool like Crystal Ball or Palisades Decision Suite. There are a couple ways to approach this with native Excel. 1. estimate the linear relationship between stocks/bonds, and generate returns for one or the other based on the regression equation, including a random variate for the error term, 2. "Correlate" the returns using a a random variate to represent correlation. So if you estimate correlation is -0.60, you create a formula that models moving in opposite directions 60% of the time, and independently 40% of the time, ignoring magnitude. The big problem is what are bond returns likely to be in the future? They are much more cyclical than stocks so once rates start to increase they will continue in that direction for some time. I just don't know when that change will start. I will try to put something together depending on what I can find for historical data.
FYI, your expected returns is insane. Real long term return (inflation adjusted is closer to 6%)
Here is where I got my input values: www.moneychimp.com/features/market_cagr.htm
But the point of the tutorial is to show you how to implement a simple Mote Carlo simulation. You can adjust the inputs and refine the model to fit your scenarios.
Hey, I have a question and I don't know if anyone can answer. Why is the median so far from what you would expect from just taking 100,000*1.112^30 + FV(11.2%,30,10,000) = 4,484,349?
Additionally, trying it out without the $10,000 annual contribution to retirement, why is the 5th and 25th percentile not what we would expect from taking the 30-year mean return and 30-year stddev and just using norminv? The 30-year return would be e^(.112x30)-1 = 2779% while the stddev would be 18%*sqrt(30) = 99%. Yet, if we do norminv(0.05,2779%,99%) we get 2712%. The 25th percentile is pretty close at 2617%.
Is there a norm inv way to get the same percentile ranges as MC if there were no annual contributions?
So you end up with a highly right skewed log normally distributed distribution, in which the mean is much higher than the median. You can download the file used and play around wit the input: alphabench.com/data/monte-carlo-simulation-tutorial.html. The variation is entirely due to the standard deviation demonstrating the difference between deterministic and probabilistic models
@@MattMacarty Thanks for the reply! Right right. I should have caught that you used the average function and the 50%ile would have been the median.
I'll play around with the sheet. Thanks for the link. I guess I'm just trying to conceptually understand it because I would have thought the lowest 5% outcomes of a monte carlo 30 years from now would be the same as using norminv(0.05,(30 year mean return),(30 year stddev))
As I took them both to mean, "in 30 years, what is the portfolio value I expect to be higher than 95% of the time).
Hi, thank you very much.
Could you please also explain the exact difference between monte carlo vs boot strapping. Would be great if could use the same example.
The only difference is the distribution used. Here I am using a theoretical normal distribution. With bootstrapping you would collect empirical data for returns and build a distribution from that to sample from. Basically, you are saying whatever happened in the past will happen again in the future.
You could probably take off the top 50 RANK or INDEX. If that's what you mean
How does the standard deviation get inputted? I don't understand why sometimes it gives a return of -30%. The average is 11 and the St dev is +/-18 then the range should be -7 to +29 right?
So if you you have a normal distribution, things happen within 1sd about 70% of the time. You see things outside this range the rest of the time.
I use MarketXLS. I think it's great for this.
Thanks
`Thank you, Matt Macarty! I use Windows, not Mac. I can't figure out how to make a formula show up as an always-visible comment on my spreadsheet the way you do about 4:12. Do you happen to know?
That is part of and add-in that works for both Windows and MAC OS. You can download here: www.alphabench.com/resources.html
If I wanted column D "Years" to update the number of rows based on the time to retire (years) that I input in cell B4, how would I go about making this selection dynamic? A drop down list selection plus the OFFSET function? Awesome video!
Thanks, glad it helped
Usually I do something like this with some IF logic, so you can make number of years dynamic based on some logical test, for example:
years to retire: 25
Then your year column:
=IF(cell_above < years_to_retire, cell_above + 1, "")
Lots of possibilities with this.
@@MattMacarty Thank you! This is very helpful, I think I can figure it out from here :)
Hello Matt am wondering how to simulate Stock Returns using Log-Normal Distribution? Do you just take the Exponent of the NORM.INV function and after doing so subtract 1 from it to get Random Returns which follow Log-Normal Distribution?
Try this one: th-cam.com/video/zrqI-NbZSj0/w-d-xo.html
It's value at risk, but the ending values do what you are looking for.
Thanks for the reply. I believe your thinking was similar to mine on "how-to" generate a list of runs that fall into a given percentile range. Can we discuss in more detail without cluttering this venue?
You might try just using the percentile function and then the max to get the range of values from a specific percentile. This might be just a as useful.
Hey Matt, I have a quick (long) question: Why is the long term standard deviation so high (cell E3)? When thinking about it in the sense of a Sharpe ratio is make sense that the market return per unit of risk will be essentially converge to 1, however the median is lower than the average so does this infer that the return for the market isn't even worth the risk? Also slightly confused... is this inferring that if we experience a 1 sigma event will net out our gains with the losses & essentially break even?
Hi thanks for the question. This is really part of a lengthy discussion, but let me see if I can address it in short form. The volatility was calculated from annual returns in the 12 years ending in 2006, however it is also a reasonable estimate of historical market volatility, if not a little low! As far as absolute returns go, annual returns are random, but not centered on 0; they have a positive drift. Also you tend to see "trends" with several up years in a row (or the opposite). Sometimes it just matters when you get into the market - if you had needed to get out in early 2009, then for you it would be bad, but if you had been just starting your career, you would already have more than tripled your initial investment; of course no one knows ahead if time what is coming.
I think you would need a more advanced tool than what I have presented. Crystal Ball allows for incorporation of correlation between random variables in their product. I am not sure if Palisades does this or not.
Thanks so much for the video. Yours shows the accumulation phase of an asset. Can this be tweaked to show a set amount of money showing random rates of return, in the distribution phase of the asset? For example, swapping "amount to be invested annually" for "amount to be distributed annually" ??
Yes this should be fairly straight forward to implement. You would add another input for the amount to withdraw annually, and then start subtracting that amount at the first year of distribution. This assume one lump sum withdrawal annually, just as the original model assumes annual contributions. A more granular model would probably give you more realistic results. If you want you can download the original model by clicking the link for resources at the top of my channel page.
How did you come to the assumption that the Rate of Return would follow a normal distribution?
If it in fact does not follow a normal distribution, then is it still correct to follow this method? :)
So in order to conclude that returns do not follow a normal distribution, you have to fit the data and run a hypothesis test. While I did not do that in this specific instance, I have done it enough times to conclude that returns can be modeled reasonably well with a normal distribution.
Hi Matt, what would be the formula for calculating rate of return at the inflation rate adjusted to 3.5% each year
You can directly subtract inflation from your return to adjust for it.
Good God turn up the volume will ya!!!
Sorry I can't reach the control from here ;)
Hi Matt, thanks for your helpful video. I've got a Question regarding probability:
I used a monte carlo Simulation to calculate how long ones retirement saving, invested in a hypothetical Portfolio with a return of 3%p.a. and a given Standard Deviation (from historical prices) will last. E.g if you use up lets say 50k each year, how likely is it, when you live only as long as the average life expectancy, whats the probability that your savings will not go below Zero.
Am I allowed to look at all 1000 Outputs of my monte carlo Simulation and then conclued (lets say 80% of the Output is above 0) 80% of the time in this simulations your retirement savings would have lasted until you passed away? or would there be another way to get this probability. thanks in advance
Yes there are a couple of ways to get at what you are looking for. I think the easiest way will be to use the PERCENTILE function on the data table. For the k argument use the percentile you are interested in, i.e. 0.80. If you use a cell reference for the k argument you can easily try any percentile you like without modifying the formula.
Great video, Matt. Thanks for posting. But I'm using Excel 2007 and my data table does not provide random outputs. Instead, it generates only one outcome for each year. What am I doing wrong? I copied your steps exactly
By one outcome, I mean the same exact outcome for each year - thanks
Thanks. To get multiple results for each year, you need to use the data table feature in Excel. You can download the file used in the demonstration here: alphabench.com/resources.html. Scroll down to the heading Monte Carlo Simulation Spreadsheets.
Hi Matt thanks for the video, I was just wondering since you were using PERCENTILE.INC, what if I want to know that 95% chance of my value will be less than certain amount? Which function should I use? I'm doing this on indexes, so I want to know if 95% chances the index will be lower than a certain value. Thanks
JeevS GOne I would still use PERCENTILE.INC.
Matt
Thanks so much for your great video. I do have a question. is there a way to trigger this to recalculate instead of recalculating every time a cell is changed or selected.
Thanks, glad it helped. On Windows press the F9 key. On Mac press command and the plus key.
Thank you! Great Video! @Matt Macarty - My question is: If you are asking Excel for a normal distribution...why does the result have skewness to it?
Glad it helped. So the portfolio is bounded on the left by 0, this gives you more of a log-normal distribution of ending values.
I think we're asking Excel for a normal distribution of return values. That does not necessarily mean that the final account balances in the simulation are also going to follow a normal distribution.
Matt: Thank you for sharing this tool. Using your tool, I am trying to calculate percentiles for each year ending value, so I can create a graph with 25%, 50%, and 75% percentiles from year 1 to year 30. Any idea on how this can be done?
The only way to do this would be to capture each path as opposed to just capturing the balance in the ending year. This would involve setting up a separate worksheet and data tables for each of the years you want statistics for. Excel will likely behave very slowly if you do this. It might be better to use something like python to generate the data you are interested in.
Thank you. it is not that I am going to use, but to see if it can be implemented. I will also try in Python.
can you explain how to do this for a range of means (eg i know the mean but i also know that my sampling mean has a standard error and need to correct for that.)
thanks!
It seems like you could do this by dividing the stdev by the sqrt of sample size. But I am not sure I understand your question.
Hello Matt! thanks for the video, it is really helpful! I would like to ask if I want to find the expected value after 60 months, is it safe to say that I can use the historical data of the past 60 months to calculate the mean and st. dev to find the value?
Hi, glad it helped. It depends I think on your assumptions really. If you think that 5 years will adequately capture past behavior then this seems reasonable. I am using fairly conservative estimates from much longer time frames in this demo. I think the longer your time horizon the more likely you are to approach historical means.
Hey Matt, I wonder where I find the data table thing if I'm using Google Spreadsheet? I don't have that much experience of excel and similar. Hope you have an answer. Thanks for a really good tutorial!
It doesn't look like there is an easy way to implement the data table in Google spreadsheets. Sorry about that.
I use What-If Analyis available through Chrome extentions. It does run noticeably slower than local programs though.
Quick question given that stock market returns are probably not normally distributed (fat tails etc..) what do you think about using actual annual returns over e.g. the past 100 years and drawing from these randomly in order to use a distribution which fits the actual data?
Not a bad idea. You might be able to find some research online about this topic. I have seen distribution fitting tests that show you can't conclude it's NOT a normal distribution, which is different from accepting that it IS a normal distribution. This is the nature of the test used to test distribution fitting. I have also seen people try to fit the stock market to Weibull and Gamma distributions. Some of the Excel add-ins like Crystal Ball will try to fit the distribution for you so that might be a place to start. I think you can download an evaluation copy.
Hey Matt, do you know how I'd be able to carry out this for the VaR? Thanks, great video
Yes I have a VaR Tutorial
Hi Matt!
Great video, thanks for that. Am I supposing right that the values for average return and standard deviation are based on historical data?
Till Pöpperling The data points I used are from an 18 year range ending in 2006. The interesting thing is you can look at any 17-20 year period and see similar average returns and volatility (within a couple of percentage points)
Indeed interesting. Thanks a lot for sharing a great tutorial!
GOD JOB BRO. BUT WHAT DO YOU CLICK TO RUN THE SIMULATION ?
Thanks. You either hit F9 in Windows or Command + in MAC to generate a new "run".
if you want to make it a vba button application.calculate should work
Can i use a Monte Carlo Simulation for my forecast sales if their have a totally random consume?
If you have an idea of the distribution of demand you should be able to forecast the range within which sales are expected to be if this is what you mean.
Hi Matt, great videos! Is you material free to use?
Thank you. You are welcome to use.
may I ask how the "formula comment" was done?? know it's a bit off-topic...
Armand Patrice Sorry for the late response! I missed this somehow. The formula comment is done with a macro. I am happy to post a spreadsheet that will allow you run that as an add in.
Matt Macarty many thanks, that'd be awesome...
OK, if you go to my channel, in the banner at the top there is a link to Resources/FIles. FOllow the link for the add in and instructions.
hi matt, thanks for the vids =) appreciate it!
i have one question though: in another video you used the norm.inv function with a mean of 0 and here you use the average return of 11,8% (i guess based on historical data). why do you do that and where is the difference? thank you very much in advance
the other video is called "how to simulate stock price changes with excel (monte carlo)" btw.
This one is demonstrating what could happen annually if you invest in a basket of stocks or the SPY ETF. So I am using historical return data (depending on who you talk to) and volatility for an annual time frame. In the stock pricing video we are simulating a one day change, and in that time frame the expected return (mean) is 0.
Matt, do you have this template as I'm trying to match mine?
Hi I have fixed the link: alphabench.com/data/monte-carlo-simulation-tutorial.html
I didnt know Jack Bauer was a quant!
You mean I sound like Jack Bauer? That's good... I think!
Is it safe to even assume the annual returns are normally distributed? Are not the daily returns assumed to be distributed but due to the compounding effect the annual returns will not be normally distributed? Thanks
Hi, thanks for your question. Yes in general as we are only estimating possible ending values for a portfolio, it is reasonable to use a normal distribution. This simulation does have flaws, but the distribution isn't one of them. The simulation assumes you deposit your money (or buy securities) at either the beginning of a year or the end of the previous, depending on perspective, you then earn a rate of return for that year. The next year you earning a different rate of return that compounds "interest" on the interest you earned previously. In the real world you would be buying securities much more frequently. You could adjust this model to reflect that if you want to download the file by following the link in the video.
Actually, most returns will fall within a range that makes them "look normal" anyway. Pretty much the only thing arguing against using the normal curve is the somewhat higher incidence of extreme returns, i.e. "fat tails". However, given the pseudo-random method of generating you do tend to see extreme values perhaps more than you would in a truely random system. Then we have to address the idea of randomness. Is the stock market really random? I don't think I would be a lone in saying no, but from the perspective of an uninterested bystander, it sure looks random -- which makes using a random process to model it reasonable.
thanks for taking the time to explain. Do you agree that if the one period distribution if returns is nornal, multi period returns would nt be (www.google.ae/url?sa=t&source=web&rct=j&url=web.stanford.edu/~wfsharpe/mia/rr/mia_rr3.htm&ved=0ahUKEwjdkvKE6q3VAhUGVxoKHXxJBawQFggjMAA&usg=AFQjCNG43U0-AUKpM5RzS54eGaAs1VzCIQ). Even in your model the ending portfolio values will not be normally distributed after multiple years. Then if we say that daily returns are almost normally distributed, would not the yearly returns end up being far from normal due to the compunding effect.
Hi Matt, I made this simulator to try clarify my point. If you simulate the daily returns you will get a normal distribution, simulate that 365 times in a row and the resulting ending value is not a normal distribution. Then how can it be valid to assume that over a year the returns will be normally distributed?
1drv.ms/x/s!AgTfphgT-fk83AisRrPVg0ZEnPGU
So when you run this, the distribution of ending values will be more like lognormal or gamma. While annual, or any period, returns can be simulated with a normal distribution, the portfolio itself is bounded on the left at 0.
thanks. the point that is confusing me is that you are assuming annual returns are normally distributed. but is not it that the log returns are normally distributed so we must do exponential on the random value you generate. Also i always used vba to run sims and its very nice to see a way to do it with datatable so now i can explain it to non vba users!
Hi Matt - it would be interesting to see how you'd build a multivariate Monte Carlo simulation.
For example, I'm trying to conceptualize if I'd get a similar/accurate result if I had 4 assets instead of 1.
Maybe I'd build a correlation matrix --> then use the standard deviation and correlation to build a covariance matrix --> then transform the covariances to correlated RANDOM variables (using the Cholesky Decomposition method) --> then calculate the returns year of year for 20 years --> Finally, then use What-if function to iterate 1000 times.
I haven't attempted yet, but I'm sanity checking my thought process here - am I missing something here? Please let me know what you'd do or how you'd do it.
Also, great video - thank you for your great contribution to the community.
~ C
Correlation is certainly something to consider when modeling specific securities. I think what you do is generate random returns for each and then rank returns such that the correlation matches some historical value. It' going to be pretty difficult with native Excel I think... You can probably find a mathematical shortcut, but it seems to me that if you don't first generate returns randomly you would be making one security's return dependent on another. Also the portfolio variance would have to be adjusted to reflect security weight and variance and pairwise covariance
Is Warren Buffet your portfolio manager
Glad it helped
So when you say "St deviation of return" do you mean that's the +/-3 sigma, or that it's 1 standard deviation? Looks to be +/-3 sigma. Not very good wording. Also, your voice is REALLY low.
That is 1 standard deviation. So 68% of the time returns are within 18% of the mean. 95% of the time they are within 36% of the mean.
Dude you just stick with your methodology pls. Simple Stupid!!! I appreciate you for avoiding all the BS we sometimes don't need to hear and jumping straight to the point .......
Thanks
For the Data Table you added at 5:49 of the video, I'm using GoogleSheets, and can't figure out how to add the Data Table using Sheets. Any advice? Thx.
Hi. I am not sure if this functionality is in Google sheets. There may be an add-in for it.
Not sure if I can. Send me your email and I will send it to you.
Well done! I have a lot to learn about EXCEL. thanks for the excellent demonstration of both Monte Carlo and EXCELL.
Glad it helped