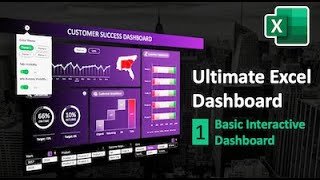
How to Create Beautiful Dashboard Background and Tile Design | Ultimate Excel Dashboard Ep. 2

ฝัง
- เผยแพร่เมื่อ 10 มิ.ย. 2024
- ✅ DOWNLOAD Background Image Here ► excelfind.com/tutorials/ultim...
📌 EXCEL VERSION: Microsoft Office 365 - Get it here ► geni.us/Office365_Microsoft
▬▬▬▬▬▬▬▬▬▬
🔥BIG NEWS ► Launch of excelfind.com 🔥
I just launched my new Excel Resource Website and kindly invite you to check it out.
I put a lot of work and research into it to provide you with the biggest possible value!
Main Website ► excelfind.com
Recommended Courses ► excelfind.com/courses
Tutorials ► excelfind.com/tutorials
Most Powerful Excel Add-ins ► excelfind.com/add-ins
And even better, I integrated the most up-to-date databases about all relevant functions, formulas, and shortcuts. You can use our advanced filtering system to filter by Relevance, Category and even minimum required Microsoft Office Version. That means you can learn about all new functions in Microsoft Office 365 with only one click!
Excel Functions ► excelfind.com/excel-functions
Excel Shortcuts ► excelfind.com/excel-shortcuts
If you like that website and want to help me grow, please consider to share it online and with everyone you know.
Thanks for your support!
▬▬▬▬▬▬▬▬▬▬
How to Create Beautiful Dashboard Background and Tile Design | Ultimate Excel Dashboard Ep. 2
In this Excel Tutorial you will learn how to create a beautiful background and gradient tile design for an Excel Dashboard from scratch. You will learn how to make use of PowerPoint for quick and effective design preparations and how to integrate your designs in an Excel dashboard file with only a few clicks.
The previous Episode already covered how to build the basic interactive Excel dashboard. And the following Episodes will go deeper into the topics of modern slicer design, automation and the integration of truly advanced features like fully functional info buttons, in-tale tab functionality and a collapsable settings area with state-of-the-art radio buttons for dashboard color theme selection and modern toggle buttons to control the visibility of specific dashboard elements.
If you want to build this dashboard yourself, we recommend to upgrade your Excel Version to the latest one which is included in the Microsoft Office 365 Subscription. Find the link for current offers in the Microsoft Store below ↓
▬▬▬▬▬▬▬▬▬▬
You want to become a master in Excel and learn all modern and relevant Excel techniques?
Then definitely have a look at the following links.
🚀 OUR EXCEL RESOURCE WEBSITE ► excelfind.com
💎 RECOMMENDED ONLINE EXCEL COURSES
GoSkills is our favourite & it’s not even close. Have a look ► bit.ly/30PWMnQ
📌 EXCEL VERSION IN THIS VIDEO
We use the latest version of Excel via the Microsoft Office 365 subscription. This allows us to have all the latest features like new chart types, a huge integrated icon library, improved functions, and much more!
If you want to upgrade your version as well, we recommend to get it from the
Office 365 (subscription based) ► geni.us/Office365_Microsoft
Office 2019 (standalone version) ► geni.us/Office2019_Microsoft
▬▬▬▬▬▬▬▬▬▬
You want to show your support and help me grow?
Here is what you can do.
🚀 SHARE MY NEW EXCEL WEBSITE ► excelfind.com
☕ WANT TO MAKE MY DAY?
Buy me a Coffee ► bit.ly/2Oqg6Cu
🔥 MORE AWESOME EXCEL AND POWERPOINT CONTENT
Subscribe ► bit.ly/37bcvAB
Note: Some of the links in this description are affiliate links, meaning, at no additional cost to you, we will earn a commission if you click through and make a purchase. This supports the channel and allows us to continue to produce videos like this. Thank you for your support!
#interactive #excel #dashboard


![[LIVE] ย้อนวันวานกับนางเอกยุค 90's #คุยให้เด็กมันฟัง EP.42 (8/6/67)](http://i.ytimg.com/vi/MslQDdFwULE/mqdefault.jpg)

![[TH] VCT Masters Shanghai Playoffs - Grand Finals // GEN vs TH](http://i.ytimg.com/vi/HL-hhLrtctw/mqdefault.jpg)


I have never once wanted to "play" with excel. I think I just found a new hobby that will actually result in being better at my job. Incredible. Thank you!
It's my pleasure, Jake 😊 great to hear that!
Amazing, thank you. This is what TH-cam is for... shared learning.
Exactly! I am glad you like it 😊
I am so happy to stumble across this while in quarantine!! These are by far one of the best tutorials i have seen, please keep them coming!
Thx, thats really great. I am an Excel and reporting freak, but it is often quite tough to bring a KPI Report into a shape that suits not only the requirements of the the reporting teams, but also to have one that catches the attention of the management board for a regular use. Figures are crucial, but it's also essential to find a structure which is easily to understand for each level. This tutorial is a big help AND really simple to implement!
Thank you for your positive feedback 😊 You are absolutely right, structure and visuals are a crucial part when you try to make your analytics/ KPI insights understandable for others.
I am happy you got some value from my tutorials.
This is an even better version of your similar August 2018 video. Congratulations for the further enhancements achieved !
I’ve been searching for so long for this type of tutorial. Thank you!
This! Love your content, it's simple content that yields fantastic results. Don't stop! Thank you for sharing
Every time I watch one of your videos I learn what was promised plus like 600 other functions. Love it :)
Thank you so much, Ulrik 😊 such a positive feedback really makes my day!
Really Wonderful! Really, Thank you very much :)
One tip for who like me had problems with adapting the image to the background: regarding the background i tried many things to make it adapt to excel and I finally discovered that you need to have an image with the same resolution of your computer. Thus you can easily change the resolution using many online tools and the image will perfectly adapt to your excel file!
Thanks for your amazing videos and thanks for sharing this as this helps a lot especially dealing with currently stuck at home situations.
i'm very impressed. never thought this can be done with Excel with support from Powerpoint. thank you very much for sharing this.
These videos are absolutely incredible. I hope you get a million views!
Thank you so much 😊
This is amazing! Thank you for such a beautiful dashboard explanation.
Glad it was helpful! 😊
Really awesome content. Successfully finished one dashboard
Awesome. This adds an uncommon layer of beauty to our data viz. Thanks for sharing!
Thanks for your positive feedback, Rich 😊
Hi, I would like to thank you (and to congratulate you) for the time and effort you put into this video series. I was able to create a beautiful stats dashboard with a lot of functionality. It is (almost) perfect, except for one small detail that is enormously frustrating. I've got six rows of my data sheet that are appearing in all my charts, even when the charts are being filtered using slicers (and where the data from these six rows should be excluded from the filtering). I've tried rewriting the data, I've checked it thoroughly for errors and I can find no solution. Otherwise, I'm loving it. Thanks again for your clarity and your generosity. Happy New Year !!
Excellent tutorial!!! Thank you for sharing your knowledge!!
It's my pleasure, Marta 😊 Makes me happy that you like it!
Thank you for this tutorial , it really complemented the other.
huge thanks for sharing us this useful skills, that’s awesome!
Great video! But please note that there is a much easier way to receive the results that you did from 4:00 to 11:00. If you insert seperate boxes (instead of one big box) and group them (ctrl + g), you are able to insert a gradiënt that affects all the boxes. Please give it a try and it will save you a lot of time! :) Cheers and thanks again for your video.
Great tip - saved me a lot of time - thanks
That's a fantastic tip there Machiel. You probably saved many people a lot of time there, especially if they have to deal with multiple changing requests for addition of new boxes, fields, etc. I cannot imagine having to repeat the steps in Powerpoint if the demand for more boxes grows every month! Phew!
HAHAH WHAT A CHAMP YOU ARE THANKS,, I WAS LIKE, WHY AM I CUTTING HERE, JUST DO SEPARATE BOXES!!
Simplesmente fantástico. Parabéns.
Awesome work!
Many many thanks for this great tutorial
Wonderful and easy way to teach
This is beautiful... Thank you for sharing this
It's my pleasure, Yaqub 😊 Thanks for your positive feedback!
Hi, came across your channel today! its just great!
07:31 Woooooooowwwww...what a great feature (Subtract)! I didn't know that! Thanks for sharing it!
Glad it was helpful!
@@theofficelab A lot! Congratulations!!! Excellent video!!!
Cool, it's really helpful, many thanks
Asombroso! Saludos desde Colombia, excelentes tutoriales!
Muchas gracias, Juan 😊 me alegro de que te guste!
Wonderful tutorial. Thank you so much.
Still waiting for the custom made info button and toggle button.
Thank you again
It's my pleasure, Luke 😊 I am glad you are looking forward to these upcoming tutorials!
Thanks a lot for your efforts
Thank you very much. May God Bless you for this
Thank you, Ismail! Very kind of you 😊
Excellent tutoring! Eagerly waiting for the next ones...
Thanks, Maruf 😊 I am glad you like my tutorials!
You are FANTASTIC! I want to build up these skills like nobody then put it on my CV!
Thank you, Samuel. I am convinced these skills will look great on your CV!
Just Amazing.....
No words to describe about your efforts
Just a request to zoom excel in videos
Your work is just amazing buddy, it has helped me a lot
Glad to hear that!
awesome.. I made it :)...thank you!
Check out my new website excelfind.com for the Free Version of the Dashboard 🚀
⬇ FULL TUTORIAL SERIES PLAYLIST
[Ep. 1] Basic Dashboard ► th-cam.com/video/cKkXtyjleX4/w-d-xo.html
[Ep. 2] Background & Tile Design ► th-cam.com/video/NfEqCdfl23k/w-d-xo.html
[Ep. 3] Modern Slicer Design ► th-cam.com/video/CbDTFfoePZY/w-d-xo.html
[Ep. 4] Auto-Refresh Pivot Charts ► th-cam.com/video/Xdq7SE-z-Aw/w-d-xo.html
[Ep. 5] Interactive Info Button ► th-cam.com/video/RZW-vQRr0nY/w-d-xo.html
[Ep. 6] Interactive Dashboard Tabs ► th-cam.com/video/2qN5jUiJWMY/w-d-xo.html
[Ep. 7] Interactive Settings Menu ► th-cam.com/video/fCFGqj4QcJU/w-d-xo.html
Awesome tutorial. But quick question.
Why not just Use PowerBI?
Damon Neal Isn’t Microsoft Power BI $10/month/user ? Could add up.
@@blackmore_s yes, but so is excel through a 365 subscription, just about. $99 a year
Thank you for sharing
Amazing video. Thanks for sharing your skills with us. I am going to watch all yours video.
Awesome, thank you! 😊
Thanks for sharing ur knowledge
It's my pleasure! 😊
very well done brother. great work so far. Not a scam at all!
Glad you like it
This is awesome!!! Thank you so much!!! We want the 3rd part, where we can change the background color !!! Cheers m8!!
Just found your channel and love it already!
Excellent
Thank you for an awesome video.
It's my pleasure, kiwikiow 😊
Thank you so much for supporting the community. Can you cover how to link the dashboard on a separate workbook? 10x⭐ 👍
This was Awesome! Eagerly waiting for the next one. So when is that coming?
Thanks, Bro! 😊 The next one will be coming in about two weeks
Amazing
Simply superb
Thanks, Bro 😊
Could you create a video displaying how to edit the image dimensions to fit the full excel background
Really helped my new project thanks
Glad to hear that 😊
Hi,
Thanks a lot for the demo! Would it be possible to have the same with 2 Pivot tables instead?
Complexity is different because Pivots are embodied in cells directly ..
1999 x 1125 comes up a weird size for me in powerpoint. How do I fix? You didn't go through how to change dimensions!
Thank you for the wonderful tips. By the way, please let me know from where I can get the icons for Delivery and Sales
we are looking for more wonderful tutorial
That's great to hear, Mohmmad! 😊
Great content.
Thank you 😊
great!!!
Glad you like it!
Unbelievable!
Hi The Office Lab
Really cool video could you tell me what your page layout settings are on because if I use the same resolutions for my picture as yours then its to small, could you help me here ?
Great and amazing tutorial, but what is not really clear to me is how to handle the size of the background and the canvas itself. What happens if I use a different picture as a background and how I define the size of the canvas? Thanks in advance
I really needed this. Thank you
Thanks, LexC 😊 Glad you like it!
very nice
Thank you, Pyae 😊
Great video! The background always tiles. This always happens with excel. How did you do your background so it didn't title. Thanks.
Awesome tutorial but couldnt get the same result when using the subtract option.is there an alternative?
Great videos, I cannot seem to get my background to cover the entire excel worksheet. Its either one and a half photos or many small photos. Help!
Thanks man! this is awesome. However, I got trouble with that Dimension. For some reason Inserting that image as a background into an Excel sheet is not working for me as I ended up with a bunch of same images next to each other. I even use your background image...=/
Hi, Ids it possible to change the colour of those partition lines after merge shapes? Those are appearing black
I hope we are getting part 3 tomorrow,😁
Yeah, that's the plan 😊
10:23 Try THIS with Black-Violett-Black, 45% Angle, 20% transparency! thats my favor
Awesome video tutorial. Is there a way to import data from Google Sheets to Excel? I prefer doing the dashboard in Excel. Thanks.
Thank you, Sir 😊
Regarding your question, I don't think there is a built-in functionality for directly importing Google Sheets into an existing Excel file, but you can easily convert a Google Spreadsheet to Excel format. Just open the sheet and go to File > Download as ... and select "Microsoft Excel". Hope that helps.
Amazing video. Would love to see more of two color gradient combinations. Kudos to you 👏👏
Q- will this work smooth in 2016 versions?
Thanks, bro!
Well, for the whole dashboard you need the 2019 or 365 version.
However, when only considering the designing part in this video, the 2016 version should be fine and work smooth.
Hope that helps and I wish you beautiful day 😊
@@theofficelab Whats about 2013 version ? cause i only have office 2013, thx 4 answer
@@theofficelab thanks much.
I LOVED this tutorial but for whatever reason my spreadsheet won't show the background image!!
would be please tell me how can I change the brightness of a dashboard background directly in excel sheet.
Thanks for your amazing but simple sharing.
I just have one concern, I tried to save pic as your recommendation, but the dimension is 960 x 540 only. It leads the frame does not fit well when I inserted on excel.
Could you help me with that?
Hi Do NGO Huy,
did you use the image I used with dimension of 1920 x 1080 for the raw image?
@@theofficelab hi,
i did use the same pic than you and got a 15' screen and it is still splited in 4 pieces i have insert as your command using "PNG". Can you help ?
@@emilywatson6666 Hey, I am having the same issue, did you get a solution for this ?
Please how can I change the image resolution to the desired one (1999 x 1125) as in the tutorial
Thanks
What program did you use to make this video?
hey I have the same dimensions and all but then when I insert the pictures it is way too big even if the format is the same as yours and as a side note when I zoom in excel the upper bar (ABC etc) gets bigger too if you know what I mean
Hi there, thanks for these tutorials I think they are great. Quick question: I'm trying to replicate the interactive info button you mention in Ep 1. Could you give me a hint on the tools you used to create it?
Hi there 😊 that will be covered in detail in Ep. 5 (coming in a few weeks).
But sure, I can give you a hint beforehand: What you need are the icons (button) and shapes (rectangle & textbox) available in Excel + a little bit of VBA. In the VBA scripts you change the visibility status of the InfoBox and connect that script to the button. To make the button know what do on the next click (either hide or display the info box) you can either use two buttons (one per button state that will be displayed with clicking on the other one) or you change a property of the button (e.g. the color) and execute the action based on the current state of that property (color).
Hope that is good starting point for you.
Apologies if I missed this. If new data is added to the main sheet, are the charts on the dashboard automatically updated or do you have to select Refresh Data every time?
Very good question 😁 the answer is no, the charts are not automatically updated, but I'll show you how to solve that and make them automatically update in Episode 4 of this tutorial series (coming in 2 weeks).
If I try to merge and subtract then the white remains same and I'm not able to see fragments of black but still except for the rectangles removed on the guides
Hi,
thank you for the tutorial :)
However i still don't understand how you make fit the image on the full screen . Mine is always split. Yet I made sure to take the same image than you. Can you help or advice me on to resize it ? i have Office 2019 pro plus so i have the same function than you.
Best & thanks again
hi, did you figure this out? I'm currently struggling with this.
I am using 2013 version and I can see all the options same as 2019.
When I try to resize the background image to 1125x1999 cm it turns to black.
Even after importing the background image in original to excel sheet it becomes completely black after adjusting the size.
Kindly help.
Hi There, I tried this and its brillent , just one thing to note if you are using Macpro book (which is rubbish as there are so many restrictions comapred to Microsoft ) it will not allow you to copy from Powerpoint as background , you can do all the picture formatting in excel but it will be a little different. Please let me know if anyone found a way to transfer to Mac (the crap).
I really love the design and work you shown us in this awesome vid, but unfortunately for some reason, it didnt work for me as i followed your step to step guide. The problem i face is when i put background image in excel, the bg is zoomed (although it has the same dimensions as mentioned), and the PPT part where you substract the rectangles, in my case the rectangles just disappears :(. But great vid tho! i just hoped it worked for me.
same issues bro... did you find any solutions?
DEAR SIR, I have tried to create background and all made same as per you only thing is that the size of each font charts and slicers are very small need to increase size everytime and slicers size is very very smal... please help
Amazing video thanks - how do I change the dimensions? I am using windows office 365. Cant find it for the love of money... help anyone
Hi Mike, thanks for your positive feedback!
Dimensions of your background image cannot be changed in Excel. You have to adjust the resolution/ dimensions of your image before you add it as a background.
I don't see the site with the screenshot shown in the tutorial here
I cannot seem to stop the image repeating, even if I use the image you use in the video via the download link? my 365 is up to date
Hey Sir
Can I Suggest things I wish you can do ?
Hi John 😊
Absolutely you can suggest things. I am always open to ideas and inspiration. The best way to do that is to send you ideas to info@excelfind.com for now and I will check on them.
Just as a little heads-up, I have a lot of topics already planned for the future, so if I like your idea it might still take some time till I do it.
i do right click but don't find add grid lines
I didn't understand how was picture taken into PPT?? Time 2:54.. Could you please help from where you have inserted.. I tried in excel find but i didnt and understand.
Confirmation code/link not sent to my email from you website. I tried multiple times.
My dimensions in png is coming less and pictures get repeated how should I increase dimensions . I used stock images from ppt
HELP .... I copied the shape from PP and pasted it to Excel but it pasted in different color
When is part 3 releasing
I am glad you like it. Next part will be coming in less than a week 😊
How do you prevent scrolling the dashboard up/down (left/right) in a worksheet?
You can do that in the Visual Basic Editor. In there you can set the properties for each worksheet. There is one property called 'ScrollArea'. Just put in the area (e.g. $A$1:$H$100) you want to the user to be restricted to. Hope that helps 😊
I followed the steps and signed up and subscribed but I never got a password to download the templates
Hi Tech4All.
I am sorry for the inconvenience.
Please shoot me a mail at info@excelfind.com and I will handle the issue.
Kind regards
Hello, when I make my shapes and add my graphs on top of them.... it seems that the graph end up below the shape. So the graph colors are not bright/clear. I’m not sure how to lock the shapes so that they are behind my graphs. Any advice is welcomed 🙏🏽
Hi Kelly, you can easily control the order of the shapes in the 'Selection Pane'. Just click on any shape and then you should be able to open the 'Selection Pane' in the 'Shape Format' tab. Another way to instantly send a shape to the back is to right click on it and click on 'Send to Back'. Hope that helps 😊
The Office Lab Yes that solves it! Thank you so much ! My dashboards don’t look basic anymore!
Is there a way to display excel in full screen?
If you are on Windows try: Ctrl + Shift + F1
Hi how can I add map on my dashboard. I have Office student and home 2016 version. When I check on my maps option all I have is the 3D one. It does not give me the same option you’ve shown on this video. Pls help
Hi MarieLumen, the Map Chart feature as shown in the tutorial is only available in Office 365 (now called Microsoft 365) or Office 2019. If you want to learn more about these versions, please check the links in the description.
The Office Lab thank you for the repsonse. 😊 I was able to create my very first dashboard. Thanks to you.