i always come back to this video, thank you so much for helping clarify this! one doubt though, we can only use the mean +/i 2 SE if the data is normally distributed? if it is not , what is the correct way to do it?
Hello, I watched your video on the error bar. I have one question if we can judge the significant difference by seeing error bar then why we do post hoc test to check the significant difference.
In fact, whether two error bars of 95%CI overlap or not does not return the same results as significant testing. When two error bars of 95%CI do not overlap, this corresponds to p
@@ayumishintani7044 Thanks a lot for sharing knowledge. Does it mean that we cannot conclude the p value based on the error bars? How did you calculate the p value?
Hi. I really appreciate your way of explaination. Could you please tell me the reference from which you took this material?. Any book or paper ?. Thanks
Hello!! thank you for this lecture! But I still cannot catch up why standard deviation should be used with table and why not in graphic? and Why confidence interval is more effective in graphic than standard deviation?
I don't think she means that SD is not good for graphic. It can be useful, but only for describing the data, since the bars representing data can be a little misleading because the data are more spread out. CI is better when talking about the statistical difference between two groups, because on the formula of CI the "n" is taken into account, and therefore it is more accurate for showing a difference (and if you see a graph for showing the difference, it is better to show the CI, so you can see if the "possible difference" overlap much (not different) or nothing at all (very different).
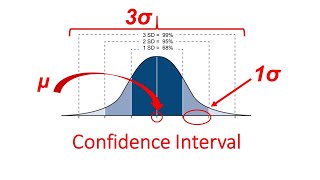
Define standard error, standard deviation, and the 95% confidence interval in your own words When you should use each of them? How they relate to each other?


Thank you Ayumi. I am studying for the Psy/soc section of the MCAT, and I found your lectures to be highly valuable.
EXTREMELY VALUABLE - and quick and clear. Thank you!
Nice explanation 👍
Wahoo! The shortest clearest explanation! Thank you!
i always come back to this video, thank you so much for helping clarify this! one doubt though, we can only use the mean +/i 2 SE if the data is normally distributed? if it is not , what is the correct way to do it?
I recommend using Box-whisker plots for non-normally distributed continuous variables.
just wow. you are really amazing with your ease explanation
. Thanks alot
Extremely helpful, top notch!
Hello, I watched your video on the error bar. I have one question if we can judge the significant difference by seeing error bar then why we do post hoc test to check the significant difference.
In fact, whether two error bars of 95%CI overlap or not does not return the same results as significant testing. When two error bars of 95%CI do not overlap, this corresponds to p
@@ayumishintani7044 Thanks a lot for sharing knowledge. Does it mean that we cannot conclude the p value based on the error bars?
How did you calculate the p value?
Thank you for this video! i still didn't quite get the exact reason why SE is wrong and CI are commonly used to show statistical difference
awesome explanation... thanks.
HUGE thank you!! This was so clear and helpful :)
Hi. I really appreciate your way of explaination. Could you please tell me the reference from which you took this material?. Any book or paper ?. Thanks
I happen to see the same example in this paper but i am not sure if it will help you .
www.sciencedirect.com/science/article/pii/S1883195814000024
Hello!! thank you for this lecture! But I still cannot catch up why standard deviation should be used with table and why not in graphic? and Why confidence interval is more effective in graphic than standard deviation?
I don't think she means that SD is not good for graphic. It can be useful, but only for describing the data, since the bars representing data can be a little misleading because the data are more spread out. CI is better when talking about the statistical difference between two groups, because on the formula of CI the "n" is taken into account, and therefore it is more accurate for showing a difference (and if you see a graph for showing the difference, it is better to show the CI, so you can see if the "possible difference" overlap much (not different) or nothing at all (very different).
thank you, really helpful!
Thank you so much !
Thank you!
hello, kindly send me error bars command in stata, what is the reason why the error bars is not showing in my spss dataset.
Define standard error, standard deviation, and the 95% confidence interval in your own words
When you should use each of them?
How they relate to each other?
3:43
5/10 is 2 not 5
I love you Ayumi