I was really thinking from so many days to watch any video describing about XRD technique... But then I was procrastinating due to such long duration videos.... Thanks a lot sir and u described it very well and in very easily understandable manner as usual...
Peak can be broadened due to many factors, but most significantly non-uniform stress, small particle size, alloying, low incidence angle (in case of GIXRD), etc.
@11:45 As you mentioned, peak 1 & 3 will be destructive, similarly, peak 2 and will be destructive. Then, where does constructive interference will come from? It means no XRD signal whatsoever.
Plane 1 n 3 give constructive waves .but because of the introduction of plane 2 which is at half of the path difference it cancels wave from plane 1. Similarly there will be another lattice which will cancel plane 3 contribution which is not in picture. The conclusion of the discussion is that what layer 2 is not present then there is a peak and because of the introduction of layer 2 it vanishes
@@AllLabExperiments Yes, that's what I meant. This represents BCC. Since plane 1 wave is cancelled by mid plane. Similarly, mid plane cancels the bottom plane. So, how do we get peaks in BCC? Since the structure is periodic, we can just focus on this particular unit cell.
@@_The_Alchemist_ This is just one condition obeying bragg's law. BCC structure will not show a peak for this respective plane. But at other angle when it obeys for other planes (@6:30) it may show peaks. And the overall pattern confirms that it is BCC (@12:00).
@@AllLabExperiments No no. My question is for this unit cell which has simply these 3 planes which are going to be repeated throughout the lattice. And if you are saying that at some other angle there may be the reflection, then the systematic absences is hoax. Because when we put the crystal in the machine, it will be scanned over a range of theta. So, why to discuss systematic absences then.
@@pankajinimahanta9830 thanks for your words. Please check out my latest videos on raman characterization and research paper writing. Those will also help you in the field of research.
Great video! You nicely connected so many concepts together, specifically about strain (compressive and tensile) and what the literal peaks would do in response to that in the data! I now understand XRD better. Thank you from the US :)
When will I consider a peak amorphous ? If the peak is broader , should I consider it is crystalline with very small crystallite size or an amorphous material ?
very good video. one problem is that what is the value of the shape factor (K). how it is coming 0.9. If is there any calculation for 0.9 then please tell me.
Like in Barium titanate it is tetragonal in nature. So if you look at it from three different sides from two sides there is one inter planar spacing and from one side you see a different interplanar spacing so you see 200 and 002 peaks split because of different inter planar spacing. This splitting may not be visible for lower angle peaks because they don,t get resolved properly by then but with increasing angle they resolve better and you can see them as separate peaks easily.
Nice explanation.. I have one query related to peaks.If we do powder xrd on single crystals of two sets of same compound then in one set peaks coming along 00l direction and in another set peaks are coming 00l as well as hkl. So wht is the reason in one set getting peaks only of 00l and in another 00l+hkl? Eventhough both sets grown under same conditions.. Will u share your views for the same? Thanks and regards,
First check the JCPDS card of your material or match your data with the literature. You can compare your data with them and determine the shape of the crystal. Different peaks will appear for different structures by matching them you can come to a conclusion of shape... But before that your should have known the composition of your material.
@@AllLabExperiments Thanks for your answer. Yes, I am comparing different instruments with different source power levels and the goniometer radius to see if/how the power and sample distance affect the S/N of a specific sample. Is there an equation you may share please? Thanks.
No these is no such eqn. Not just power but the placement of the sample n how much radiation a sample absorbs also matter. So it is not easy to bound all the things and derive a formula which is not even useful
The topic is covered in the video... as structure varies the intensity of the peak change relatively but the answer is not straight forward because peaks are because of the sum of many constructive and destructive interferences.
sir please tell me that ' istexture cofficient of high intensity peak is always greater or may be smaller peaks also have high value of texture cofficient
Sir please do you have any vlog or any idea or if you can make any vlog about how to find dislocation density from XRD data. I will be very thankful to you
Sorry Sohail but I don't have an experience in dislocation density. But I have found many discussions on this topic on Research Gate. You may read this. For me It may take some days to understand this and then revert accordingly.
Hi Sir, assuming that the x-ray wavelength is 1 Å and the bragg reflection is 16 degree. Will the angle changes when the x-ray wavelength decrease or increase? If d consider as resolution, means changing the angle (theta) helps getting better resolutions?
d is known as space between inner plane. but does it related to the resolution of image we get? like to lower inner space plane gets better resolution image. And if x-ray wavelength changes from 1 Å to 0.5
@@jocelynel9867 yes there will be a difference of resolution. But i have to look some books for this. See some good book on xrd and you may get the required expression.
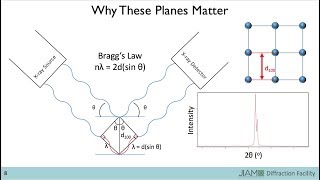
Atoms don,t reflect but it is the interatomic distance which causes diffraction. Diagram is symbolic representation. There is a plane above that plane as well. N the atoms on one plane and another plane not exactly aligned make slits causing diffraction.
In your XRD pattern, the relative intensity of different peaks depends upon the position of atoms with in the lattice as you have seen in this presentation. Now what if you increase the intensity of your x-ray source? In case of heavy radiation the intensity of all the peaks increases proportionally and vice-versa. Additionally, If you increase or decrease the scanning rate then also the intensity varies so we write it arbitrary. The interesting fact is that in all cases the pattern of peaks doesn't change. for example If peak for 011 is the highest and for 012 plane it is around half of the 011 then for any x-ray source intensity or scanning rate this ratio will remain the same if the detector is capable of recording it.
@@AllLabExperiments Thank you very much for clearing my doubt. One more quick question if I use theta - theta goniometer then can I plot graph of intensity vs theta rather than 2 theta?
@@sheetalSonar Sorry I missed your comment. In fact 2 theta is just a convention. There is no harm even if you plot it against theta but the reviewers of your paper may get confused by this. So in my advice don't do this unless there is a strong reason for doing this.
@@AllLabExperiments , hi.. I have a quick question. If increasing peak intensity results in a higher peak, is there any setting for the X-ray intensity that needs to be emitted towards the sample in order to get a good match with the fingerprint diffraction pattern of the sample ? The arbitrary unit is still somewhat confusing to me.
A very nice video that gives a clear understanding of XRD basics. I have one doubt haw to analyze peaks in terms of h k l values and plane of peaks mainly how to assign planes for particular peaks?
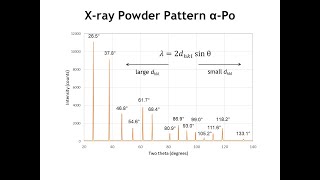
Consider you xrd a random sample about which you don,t know. Then from the available peaks you get to know about all possible inter planar spacings in that structure and then you match your data with the available peak patterns of different structures or do back calculation to know about the structure... You must have noticed in one of the slides that simple cubic, BCC, FCC have a certain pattern of visible peaks... just that helps to identify the structure...
But my friend this eng is very simple and we don,t get audience in hindi for science. Neither people donate or even subscribe. So it is very hard to get value of your efforts even with english when you are making intellectual stuff.


after hours of search I found this video...and it just contains all the things I want to know, great work sir !
I was really thinking from so many days to watch any video describing about XRD technique... But then I was procrastinating due to such long duration videos....
Thanks a lot sir and u described it very well and in very easily understandable manner as usual...
Thanks Akshi. Now i am going to make some research related videos. Please share with your friends.
@@AllLabExperiments I already did...
Best XRD explication. Thank you sir. Your are an Angel. ❤️👍👍👍👍👍👍. Indians are genius
Consequent, clear, straight to the deal. You’ve made a great work!
Nice presentation of xrd
Best video I have ever seen on XRD! Thanks a lot.
Please Checkout my latest video on Raman Effect and Spectroscopy.
Really, really good video for XRD beginners.
Very much appreciated!
Really a good video at least I've found on TH-cam for understanding XRD method.
Planning to launch more videos on characterization techniques.
Wow really nicely explained sir
aWESOME EXPLANATION
Woderful 1st time fuly understood the XRD
Thanks Mohammad Zubair
Thanku so much sir.... Respect from Pakistan
Excellent!!
Very Well Explained...
Systematic teaching and covering all the important points about the topic...
Thank you for this video and efforts👍
Thanks Muskan
best class on XRD i have ever seen
@@arup812 thanks. One more Vidro on Raman Characterization and Analysis is also there. You can watch that too...
Best video on xrd.. Please make a video on CVD and PVD..
Raman video is out. SEM video is next. Rest on waiting list.
Peak can be broadened due to many factors, but most significantly non-uniform stress, small particle size, alloying, low incidence angle (in case of GIXRD), etc.
Absolutely... Also Watch my latest video on Raman Spectroscopy.
An excellent explanation. Even biology people can understand this complain technique
When DNA was discovered. Biologists struggled a lot about XRD.... unfortunately At that time my video was not present... Not even youtube...lolz
@@AllLabExperiments 😂👌
@11:45 As you mentioned, peak 1 & 3 will be destructive, similarly, peak 2 and will be destructive. Then, where does constructive interference will come from? It means no XRD signal whatsoever.
Plane 1 n 3 give constructive waves .but because of the introduction of plane 2 which is at half of the path difference it cancels wave from plane 1. Similarly there will be another lattice which will cancel plane 3 contribution which is not in picture.
The conclusion of the discussion is that what layer 2 is not present then there is a peak and because of the introduction of layer 2 it vanishes
@@AllLabExperiments Yes, that's what I meant. This represents BCC. Since plane 1 wave is cancelled by mid plane. Similarly, mid plane cancels the bottom plane. So, how do we get peaks in BCC? Since the structure is periodic, we can just focus on this particular unit cell.
@@_The_Alchemist_ This is just one condition obeying bragg's law. BCC structure will not show a peak for this respective plane. But at other angle when it obeys for other planes (@6:30) it may show peaks. And the overall pattern confirms that it is BCC (@12:00).
@@AllLabExperiments No no. My question is for this unit cell which has simply these 3 planes which are going to be repeated throughout the lattice. And if you are saying that at some other angle there may be the reflection, then the systematic absences is hoax. Because when we put the crystal in the machine, it will be scanned over a range of theta. So, why to discuss systematic absences then.
Amazing Video ... Loved your explanation.
'
Thank you very much for this excellent video 🙏🙏
@@pankajinimahanta9830 thanks for your words. Please check out my latest videos on raman characterization and research paper writing. Those will also help you in the field of research.
Very good explanation, GOD bless you.
I like it
Great video! You nicely connected so many concepts together, specifically about strain (compressive and tensile) and what the literal peaks would do in response to that in the data! I now understand XRD better. Thank you from the US :)
Hi... Please watch my latest Raman Video for extended details on Raman Effect & Spectroscopy.
Very helpful video....thank you so much sir
pefecttttttttttt xrd concept
Thanks
Great 👍,, educative
A very comprehensive video, easy to understand, thanks
Really impressive, great job🎉
Thank you for your very good explanation finally I got it😊😊😊
Thank you so much..explained so well ..very easy to understand.
Thanks dear
Simple and crystal clear
Please Make a video on Reciprocal lattice and Brillouin Zone, and their application in X-ray diffraction.
Very Nice Sir, ❤
Excellent explanation.........V.Good
Thank you for informative video
Thank you for the video, it's really helpful.👍
Great video! Very well explained!
Wow kya baat h sir,
Sir can u tell me what is the effect of particle size on the broadening of Raman peaks
Acc to 4-5 marks in detail......
very good video sir. THANK YOU VERY MUCH
Thankyou Brother. Thanks a lot. This saved a lot time. Liked. Subscribed
Excellent. God bless you abundantly.
Very much informative. Thank you sir
Brief and informative
Great video!!!!!
Thanks for making the wonderful video. Please add the analysis part also. Small angle and wide angle xray techniques also.
Good Work, gentleman
Can we explain for example am the dissolution of a clay mineral in terms of lattice strain?
@@youwilllaugh3136 i guess this is amorphous. And i think for an amouphous it is not possible to get strain.
Thank you for making a such type of video very well explained in a systemetic way
Do the order of diffraction changes the information about the interatomic structure
@@lokithaloki8780 no. Its intensity is very low and for n=2 it will give the same info
Thank you so much! I have a lab tomorrow and this helped a lot!
Well explained....
Thank you its simple and clear
You did a great job ❤
❤ thank you so much sir
thanks a lot, sir to explain the XRD very well and will give very help to researchers.
☺️🙏
Interesting!!
woo fine explanation
When will I consider a peak amorphous ? If the peak is broader , should I consider it is crystalline with very small crystallite size or an amorphous material ?
Amouphous is not peak.its a broad platue...
Why is the right side of brags law constant?? Thank you
very welll explained Sir
very good video. one problem is that what is the value of the shape factor (K). how it is coming 0.9. If is there any calculation for 0.9 then please tell me.
This is an average value taken average for all shape values because we rarely know the shape of crystallite present
Very useful video
Loved this video. You are an awesome teacher. Thank you. Also, can you please explain the splitting of peaks in XRD graphs?
Like in Barium titanate it is tetragonal in nature. So if you look at it from three different sides from two sides there is one inter planar spacing and from one side you see a different interplanar spacing so you see 200 and 002 peaks split because of different inter planar spacing. This splitting may not be visible for lower angle peaks because they don,t get resolved properly by then but with increasing angle they resolve better and you can see them as separate peaks easily.
Nice explanation.. I have one query related to peaks.If we do powder xrd on single crystals of two sets of same compound then in one set peaks coming along 00l direction and in another set peaks are coming 00l as well as hkl.
So wht is the reason in one set getting peaks only of 00l and in another 00l+hkl? Eventhough both sets grown under same conditions..
Will u share your views for the same?
Thanks and regards,
Sorry but i am not an expert on single crystals but yes I can look into it in my free time and reply as soon as i get the answer.
Zabardast🎉
VERY NICE , THANKS A LOT
Thank you Sir❤️👍🙏🏻
nice lecture
Excellent explanation
Excellent video for XRD beginners. Thank you
How can i determine that this xrd pattern is of cu ic,rhombohedral and tetragonal etc
I shall b thankful for ur answer
First check the JCPDS card of your material or match your data with the literature. You can compare your data with them and determine the shape of the crystal. Different peaks will appear for different structures by matching them you can come to a conclusion of shape... But before that your should have known the composition of your material.
@@AllLabExperiments But sir, if you know nothing about the sample, how will you proceed. Please guide me Sir.
wonderful video sir.
appreciate your effort. it helped a lot , thanks
Great video
very informative
Thank you for making such a simple and informative video on XRD
Such a great and helpful video. Thank you!
Thank you so much sir.., understood clearly🙏
wonderful. Thank you
Excellent.. please make more videos with the origin of how to use the Williamson method and other parameters by XRD please.
Soon
Very clear and lucid explanation. Thanks for creating such great quality videos.
Thanks bro. Bs aap dosto ka saath rahe to aise hi kaam chalta rhega....
excellent explanation
Thank you sir
Thanks for the video. Is the signal intensity affected by the x-ray source power level and sample distance from the detector/or x-ray source?
Yes but in that case all peaks will proportionally decrease or increase and their relative ratio will not change...
@@AllLabExperiments Thanks for your answer. Yes, I am comparing different instruments with different source power levels and the goniometer radius to see if/how the power and sample distance affect the S/N of a specific sample. Is there an equation you may share please? Thanks.
No these is no such eqn. Not just power but the placement of the sample n how much radiation a sample absorbs also matter. So it is not easy to bound all the things and derive a formula which is not even useful
In XRD graph, some are high intensity and others are low intensity peaks, then what structure it can be classified?
The topic is covered in the video... as structure varies the intensity of the peak change relatively but the answer is not straight forward because peaks are because of the sum of many constructive and destructive interferences.
sir please tell me that ' istexture cofficient of high intensity peak is always greater or may be smaller peaks also have high value of texture cofficient
Sorry bt i havent worked in this field so don,t know much about it
Best explanation
Excellent sir
thank you sir, nice explanation
Sir please do you have any vlog or any idea or if you can make any vlog about how to find dislocation density from XRD data. I will be very thankful to you
Sorry Sohail but I don't have an experience in dislocation density. But I have found many discussions on this topic on Research Gate. You may read this. For me It may take some days to understand this and then revert accordingly.
Hi Sir, assuming that the x-ray wavelength is 1 Å and the bragg reflection is 16 degree. Will the angle changes when the x-ray wavelength decrease or increase? If d consider as resolution, means changing the angle (theta) helps getting better resolutions?
Yes acc to bragg,s law equation it will change. But i am not getting the meaning of 2nd part
d is known as space between inner plane. but does it related to the resolution of image we get? like to lower inner space plane gets better resolution image.
And if x-ray wavelength changes from 1 Å to 0.5
@@jocelynel9867 yes there will be a difference of resolution. But i have to look some books for this. See some good book on xrd and you may get the required expression.
at 11:48 ,in the second figure the wave(1,2) was reflected from a plane which had no atom in it ,how's that possible?
Atoms don,t reflect but it is the interatomic distance which causes diffraction. Diagram is symbolic representation. There is a plane above that plane as well. N the atoms on one plane and another plane not exactly aligned make slits causing diffraction.
@@AllLabExperiments ok thankyou it's clear now
Thank you for the video. I love it.Can we also get a video where a proper XRD pattern is interpreted and insights are made from the plot Thank you.
Will plan for it for sure.
Wow. Very precise and accurate
Hello sir, you have explained very well . can you please elaborate on why we use the arbitrary unit for intensity in the XRD pattern?
In your XRD pattern, the relative intensity of different peaks depends upon the position of atoms with in the lattice as you have seen in this presentation. Now what if you increase the intensity of your x-ray source? In case of heavy radiation the intensity of all the peaks increases proportionally and vice-versa. Additionally, If you increase or decrease the scanning rate then also the intensity varies so we write it arbitrary.
The interesting fact is that in all cases the pattern of peaks doesn't change. for example If peak for 011 is the highest and for 012 plane it is around half of the 011 then for any x-ray source intensity or scanning rate this ratio will remain the same if the detector is capable of recording it.
@@AllLabExperiments Thank you very much for clearing my doubt. One more quick question if I use theta - theta goniometer then can I plot graph of intensity vs theta rather than 2 theta?
@@sheetalSonar Sorry I missed your comment. In fact 2 theta is just a convention. There is no harm even if you plot it against theta but the reviewers of your paper may get confused by this. So in my advice don't do this unless there is a strong reason for doing this.
@@AllLabExperiments Thank you so much for prompt reply.
@@AllLabExperiments , hi.. I have a quick question. If increasing peak intensity results in a higher peak, is there any setting for the X-ray intensity that needs to be emitted towards the sample in order to get a good match with the fingerprint diffraction pattern of the sample ? The arbitrary unit is still somewhat confusing to me.
very nice video
A very nice video that gives a clear understanding of XRD basics. I have one doubt haw to analyze peaks in terms of h k l values and plane of peaks mainly how to assign planes for particular peaks?
Consider you xrd a random sample about which you don,t know. Then from the available peaks you get to know about all possible inter planar spacings in that structure and then you match your data with the available peak patterns of different structures or do back calculation to know about the structure...
You must have noticed in one of the slides that simple cubic, BCC, FCC have a certain pattern of visible peaks... just that helps to identify the structure...
Nice presentation! Could you please explain how can we find out the chemical structure of the particle by using the lattice parameter?
Use literature to match that data and you can find out the chaemical and its structure
Students are confused due to course wich is in english . so they come on youtube for understanding.But here you also speaking eng 😂😂😂😂
But my friend this eng is very simple and we don,t get audience in hindi for science. Neither people donate or even subscribe. So it is very hard to get value of your efforts even with english when you are making intellectual stuff.
Converting these video to hindi is in future plan. When i earn enough money from youtube equivalent to the efforts i make
excellent...thank you
nice explanation