Spatial Interpolation Techniques in QGIS

ฝัง
- เผยแพร่เมื่อ 17 ก.ย. 2023
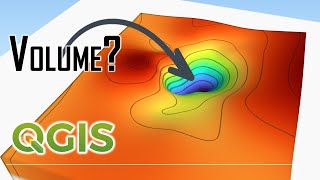
- In this tutorial, you will learn how to make use of a discrete point dataset to generate a seamless continuous raster using a number of different geostatistical interpolation methods.
Geostatistical interpolation methods are a set of powerful techniques used in Geographic Information Systems (GIS) and spatial analysis, including within the QGIS environment, to estimate and predict values at unsampled locations based on observed data. These methods are particularly valuable when dealing with spatially distributed data and can be applied to various applications. Popular geostatistical interpolation methods include Kriging, Inverse Distance Weighting (IDW), and Spline.
In the first part of this tutorial, we will see how to make use of Voronoi Polygons (which is also known as Thiessen polygons) to define an area of influence based on the proximity of each point to one another, and create a rainfall distribution map based on a point dataset. We will make use of a color ramp in order to visualise the polygons which shows the gradient of the variable with a clear distinction of the high and low values.
Following that, we will use a very commonly used geostatistical interpolation method called IDW, which stands for Inverse Distance Weighting in order to generate a seamless continuous raster, by predicting values for unknown areas based on the available point values in the same dataset.
Finally, we will also make use of another interpolation method which is called Thin Plate Spline (which you can find under SAGA tools in QGIS) to perform a similar task, and then we will compare the results and see how each interpolation method differ from one another, with some thoughts on how to select a specific interpolation method for a given task at hand.
Download the average annual rainfall sample dataset - drive.google.com/drive/folder...


![แขกคนแรกร้านแจ๊ส [ซี - เอมมี่] | iJazzKhunJang](http://i.ytimg.com/vi/XP6C9kulFfc/mqdefault.jpg)
![USAB Showcase: CANADA vs USA [OFFICIAL STREAM]](http://i.ytimg.com/vi/m9Cz3xsdDgc/mqdefault.jpg)

A tutorial done with such prowess. I am in awe.
Very well articulated 👍🏻
Amazing, thank you!!
Perfect, definetely going to show this to my students!
Great! :)
Thanks and alot for an excellent tutorial and also extra thanks for providing file for practice.,🙏🙏🙏🙏🙏
Beautiful lecture
Thank you for the great explanation!
Super! Thank you!
(You’re an angel!) Thank you, super
You are the best
Tum bohot accha Kam krta h bhai.
Thanks a lot 😊
good work
Thanks,
very well explained..
Can you help me, I have a query.
What feature or tool can I use in ArcGIS to show the Metro line expansion over the years and built-up area expansion along it(say, 3km proximity)
Thank you, how to show this interpolation on a world/country base map
please explain.
This is great! Are these points georeferenced?
A full demonstration for vic model would have been great....
Hi, i'm not really familiar with it. What's it used for?
Not sure why It doesnt let me do the IDW with the british grid..
Do such results occur even in small-scale areas, like within 20k sqm?>
Hi, I'm trying to do interpolation of solar radiation across a country. Which method would you recommend I use?
Been getting these Indian tutorials that lack depth, but this has made appreciate the interpolation technique in GIS. Thanks
As students for your vedios i would like to contact you sometimes need for your help. Where would i contact you?
can i have this dataset?? for practice reason..
Hi sure, please check back in a couple of hours, I will make sure that its uploaded. You will find the link to download the data in the description of the video.
why didn't you show kriging?