Hi, could you perform data plot using pseudo-first order model? Preferably with the regression (linear), I would like to check how you find the values of qt, to perform the plotting of the graph with the experimental and theoretical data.
Hello sir, this vedio lecture is very helpful for non linear fitting. Thanks a lot. Could you please help me in non linear fitting of Elovich model and intra particle diffusion model. Please send me final equation for non linear fitting.
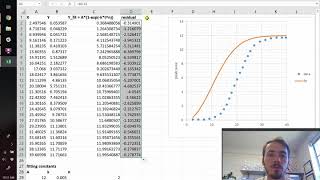
You can use the same methods (linear or non-linear) for the pseudo-first-order rate equation, just change the formulae. The rate equation is dqt/dt=k*(qe-qt). There is a linearised and a non-linearised solution to integrating this rate equation. (1) For linear fitting, the integrated solution is ln(qe-qt)=ln(qe)-k*t. You can plot ln(qe-qt) on the y-axis and t on the x-axis. Fit a linear regression to this. The rate constant k will be equal to -m (where m is the slope). Adsorption capacity qe will be equal to exp(c) (where c is the y-axis intercept). (2) For non-linear fitting, the integrated solution is qt=qe*(1-exp(-k*t)). Enter this formula in column G of the "PSO (non-linear)" spreadsheet in the video. Then use Data Solver to minimise the residual sum of squares by optimising the rate constant k and adsorption capacity qe. You can find the relevant equations in Table 1 of this paper: www.researchgate.net/publication/276919631_Kinetic_Studies_of_the_Adsorption_of_Thorium_Ions_onto_Rice_Husk_from_Aqueous_Media_Linear_and_Nonlinear_Approach/figures?lo=1 I hope this helps.
@@BunlongVictoria Hi there. You can take an initial guess of qe by looking at the graph and deciding where on the y-axis the experimental data probably ends up (where the reaction 'plateaus' or finishes). (e.g. the value in mg per gram or umol per m2 etc. where the reaction finishes). This will often simply by the y-axis value of your final data point.
How to apply shrinking core models i.e ( 1-(1-x)^1/3=kt ,, 1- 2/3x -(1-x)^2/3 =kt and other equation is mixed controlled kinetic modeling) And arrhenius equation on iron extraction ( as i extract iron with varying different parameters like temp ,time) . i don't know how to apply these equations in Excel sheets to find that which model is best fit on iron dissolution.
Thanks for making this video, really saved me! I'd like to ask why did you use the linearised equation for the non-linear fitting? I've seen a lot of works using qt=qe^2*k2*t/(1+k2*qe*t) as model equation so I don't know which one to choose...
Hi there, the PSO equation you wrote is directly rearranged into the linearised equation used in this video. (To check this, [1.] inverse your equation to give 1/qt=(1+k2*qe*t)/qe^2*k2*t. [2.] Cancel terms to give 1/qt=(1/qe^2*k2*t)+(1/qe). Then [3.] multiple both sides by t to give t/qt=(1/qe^2*k2)+(t/qe). In my spreadsheet, I would have taken the linearised equation, as I am most familiar to working with this, then rearranged to essentially give the original equation (non-linear) that you write in your comment. Hope that helps
Great day sir! If I have different concentrations (10 ppm, 15 ppm, 20 ppm, 25 ppm), do I need to do repeating experiments for each of these concentrations to find out their respective equilibrium concentration? Hope to hear from you soon.
Kinetic experiment is usually carried out at a fixed concentration (e.g., 10 ppm), adsorebt dose, pH and temperature as a variation of contact time to get the optimum equilibration time. So, if you wanna use different conecntrations then you need to carry out separate experiment for each concentration such as 10 ppm, 20 ppm etc.
Yes, and you will see some interesting effects, like PSO rate constant k2 decreasing by a factor of x2 when the initial adsorbate concentration is increased x2. We discuss these effects in our paper published in Langmuir journal
Hi Jay, thank you very much for this detailed video regarding model fitting. It was a delight to read your research paper as well. Is it acceptable to see that the adsorption rate constants, k1 and k2 for pseudo first and second order models differ significantly? There is not much statistically significant difference in your results. However, my k1 values are in the range of 1.0-0.5 whereas the k2 values are in the range of 0.09-0.02. Is that acceptable? The R2 and qe values are quite close.
That is fine. k1 and k2 have different units, so the comparison of the absolute size of the numbers of k1 and k2 is not a useful comparison to make. For example... pseudo-first order: rate = k1 * (qe-qt) pseudo-second order: rate = k2 * (qe-qt)^2 PFO: rate units = mg g-1 min-1 PSO: rate units = mg g-1 min-1 (the same units for both rate equations) PFO: (qe-qt) units = mg g-1 PSO: (qe-qt)^2 units = mg^2 g-2 PFO: k1 units = min-1 PSO: k2 units = g mg-1 min-1 Different units = comparing the size of the numbers isn't necessarily useful. One example of this is to calculate the initial rates (use the rate equation, but set qt equal to 0). This gives you PFO: rate = k1*(qe-0) PSO: rate = k2*(qe-0)^2 experimentally observed 'rate' is the same for PFO and PSO experimentally observed 'qe' is the same for PFO and PSO However, PFO rate equation uses qe^1, whilst PSO rate equation uses qe^2. So if qe is greater than 1, then k2 has to be smaller than k1 in order for PFO and PSO models to both give the same initial rate. If qe is smaller than 1, then k2 has to be bigger than k1 for PFO and PSO models to both give the same initial rate. Your experiment gives k1 > k2, so my guess is that your qe is greater than 1 (whatever units you are using...). Your k1 values are approximately 10 times bigger than k2. So I guess than your qe is about 10 (with whatever units you are using)... Best wishes
Thank you for a great tutorial. May I know, can excel solver able to solve when ln (MR-C) = ln a - Kt when we only have data for MR and t and need to find the constant value which is a, K and C?
Thanks for the question and sorry for the slow response. The more unknown variables you try to solve for, the greater the chance that you don't find the true best fit. You have three unknowns, but normally we just try to solve for one or two. But you can of course try it out and see if you have success! Did you find a solution yet?


Thank you for your videos. I came to this video after watching your video on adsorption isotherms. It helps A LOT. THANK YOU~
Thank you Jay. This is very useful vedio and you explained it clearly
Thanks for making such a helpful video.
Your a legend bro🔥🙌🏾. You have helped many of us a lot.
Hello, very nice work! Would you please make a tutorial teaching how to use the pseudo first order model? Thanks
great work. Some thing i was really looking for! thanks for sharing.
Excellent work, have read it and will use the same statistics in my study. Thanks a lot for sharing!
Very informative 🔥 💯 Thank you
Thank you Jay Bullen
Hi, could you perform data plot using pseudo-first order model? Preferably with the regression (linear), I would like to check how you find the values of qt, to perform the plotting of the graph with the experimental and theoretical data.
pudiste sacar el valor de qt?
Hello sir, this vedio lecture is very helpful for non linear fitting. Thanks a lot. Could you please help me in non linear fitting of Elovich model and intra particle diffusion model. Please send me final equation for non linear fitting.
Really appreciate your video tutorial, could you please provide one more on pseudo-first-order?
You can use the same methods (linear or non-linear) for the pseudo-first-order rate equation, just change the formulae. The rate equation is dqt/dt=k*(qe-qt). There is a linearised and a non-linearised solution to integrating this rate equation.
(1) For linear fitting, the integrated solution is ln(qe-qt)=ln(qe)-k*t. You can plot ln(qe-qt) on the y-axis and t on the x-axis. Fit a linear regression to this. The rate constant k will be equal to -m (where m is the slope). Adsorption capacity qe will be equal to exp(c) (where c is the y-axis intercept).
(2) For non-linear fitting, the integrated solution is qt=qe*(1-exp(-k*t)). Enter this formula in column G of the "PSO (non-linear)" spreadsheet in the video. Then use Data Solver to minimise the residual sum of squares by optimising the rate constant k and adsorption capacity qe.
You can find the relevant equations in Table 1 of this paper: www.researchgate.net/publication/276919631_Kinetic_Studies_of_the_Adsorption_of_Thorium_Ions_onto_Rice_Husk_from_Aqueous_Media_Linear_and_Nonlinear_Approach/figures?lo=1
I hope this helps.
@@jaybullen2887 Hi, thank you so much for the help!
@@jaybullen2887 Thank you so much sir I also find PFO non linear equation
@@jaybullen2887 May I know how do you get qe in the PFO?
@@BunlongVictoria Hi there. You can take an initial guess of qe by looking at the graph and deciding where on the y-axis the experimental data probably ends up (where the reaction 'plateaus' or finishes). (e.g. the value in mg per gram or umol per m2 etc. where the reaction finishes). This will often simply by the y-axis value of your final data point.
How to apply shrinking core models i.e ( 1-(1-x)^1/3=kt ,, 1- 2/3x -(1-x)^2/3 =kt and other equation is mixed controlled kinetic modeling)
And arrhenius equation on iron extraction ( as i extract iron with varying different parameters like temp ,time) . i don't know how to apply these equations in Excel sheets to find that which model is best fit on iron dissolution.
Thanks for making this video, really saved me! I'd like to ask why did you use the linearised equation for the non-linear fitting? I've seen a lot of works using qt=qe^2*k2*t/(1+k2*qe*t) as model equation so I don't know which one to choose...
Hi there, the PSO equation you wrote is directly rearranged into the linearised equation used in this video. (To check this, [1.] inverse your equation to give 1/qt=(1+k2*qe*t)/qe^2*k2*t. [2.] Cancel terms to give 1/qt=(1/qe^2*k2*t)+(1/qe). Then [3.] multiple both sides by t to give t/qt=(1/qe^2*k2)+(t/qe).
In my spreadsheet, I would have taken the linearised equation, as I am most familiar to working with this, then rearranged to essentially give the original equation (non-linear) that you write in your comment. Hope that helps
Thank you so much. It really helps to understand the fitting of data. Is there any mode to contact you like email?
Hi Sikha, I have some contact options listed here: www.jaybullen.com/#contact
@@jaybullen2887 thank you so much for your reply.
Great day sir! If I have different concentrations (10 ppm, 15 ppm, 20 ppm, 25 ppm), do I need to do repeating experiments for each of these concentrations to find out their respective equilibrium concentration? Hope to hear from you soon.
Kinetic experiment is usually carried out at a fixed concentration (e.g., 10 ppm), adsorebt dose, pH and temperature as a variation of contact time to get the optimum equilibration time. So, if you wanna use different conecntrations then you need to carry out separate experiment for each concentration such as 10 ppm, 20 ppm etc.
Yes, and you will see some interesting effects, like PSO rate constant k2 decreasing by a factor of x2 when the initial adsorbate concentration is increased x2. We discuss these effects in our paper published in Langmuir journal
Hi Jay, thank you very much for this detailed video regarding model fitting. It was a delight to read your research paper as well. Is it acceptable to see that the adsorption rate constants, k1 and k2 for pseudo first and second order models differ significantly? There is not much statistically significant difference in your results. However, my k1 values are in the range of 1.0-0.5 whereas the k2 values are in the range of 0.09-0.02. Is that acceptable? The R2 and qe values are quite close.
That is fine. k1 and k2 have different units, so the comparison of the absolute size of the numbers of k1 and k2 is not a useful comparison to make. For example...
pseudo-first order: rate = k1 * (qe-qt)
pseudo-second order: rate = k2 * (qe-qt)^2
PFO: rate units = mg g-1 min-1
PSO: rate units = mg g-1 min-1 (the same units for both rate equations)
PFO: (qe-qt) units = mg g-1
PSO: (qe-qt)^2 units = mg^2 g-2
PFO: k1 units = min-1
PSO: k2 units = g mg-1 min-1
Different units = comparing the size of the numbers isn't necessarily useful.
One example of this is to calculate the initial rates (use the rate equation, but set qt equal to 0). This gives you
PFO: rate = k1*(qe-0)
PSO: rate = k2*(qe-0)^2
experimentally observed 'rate' is the same for PFO and PSO
experimentally observed 'qe' is the same for PFO and PSO
However, PFO rate equation uses qe^1, whilst PSO rate equation uses qe^2. So if qe is greater than 1, then k2 has to be smaller than k1 in order for PFO and PSO models to both give the same initial rate. If qe is smaller than 1, then k2 has to be bigger than k1 for PFO and PSO models to both give the same initial rate.
Your experiment gives k1 > k2, so my guess is that your qe is greater than 1 (whatever units you are using...). Your k1 values are approximately 10 times bigger than k2. So I guess than your qe is about 10 (with whatever units you are using)...
Best wishes
I dont know why you guess qe 16mg/g instead of using formular (qe=e^(intercept)) ?
Ele acha fazendo 1/m, essa outra que e^(interceptar) é do modelo de pseudo-primeira ordem
Thank you for a great tutorial.
May I know, can excel solver able to solve when ln (MR-C) = ln a - Kt when we only have data for MR and t and need to find the constant value which is a, K and C?
Thanks for the question and sorry for the slow response. The more unknown variables you try to solve for, the greater the chance that you don't find the true best fit. You have three unknowns, but normally we just try to solve for one or two. But you can of course try it out and see if you have success! Did you find a solution yet?