I got to agree! We got this obfuscated definition of the theta-power-function - it's great for plug-and-calculate, don't get me wrong, but I didn't get what was going on at all.
@@jbstatistics I read too much on internet and also followed Montgomery book to understand how alpha and beta are inversely related to each other, but didn't understand and visualize it. You explained the things in awesome way. The world requires people like you to teach the concept instead of book worm definition. Hats off man, you did amazing job.
I'm a high school AP stats teacher, and your video is simply terrific. Was looking for something to share with my kids, who find errors and power to be mind bending. This is it! Thanks!
The graph helped tremendously. I was staring at a homework question for over 30 minutes now but figure it out since the professor never cared to explain. Thanks so much!!
why do I pay to go to college. I always end up having to learn through youtube videos like this one. this video is EXCELLENT. thank you so much for saving me and thousands of students.
You are seriously my hero for today. I was so confused on this topic until I watched just two of your videos. Everything makes much more sense now. Thank you so much JB.
I don't do a two-tailed example for a couple of reasons. But the logic is very similar to that used in this video. The difference is that you will have two rejection regions, so you will need to find two tail areas (one will be small), and add these areas.
The power of the test is the probability of rejecting the null hypothesis, given it is false (in this case, given mu = 43). So the power is not calculated by finding areas under the distribution of the sample mean when the null hypothesis is true (mu = 50), but by finding areas under the distribution of the sample mean when the null hypothesis is false (mu = 43). That's why the power was an area under the blue curve (mu=43) in the video, and not an area under the white curve (mu=50).
To find the power you need to find two areas (corresponding to the two tails) and add them. One area (the one on the opposite side of the true value of mu) will be small. The other area (the one on the same side as the true value of mu) will be bigger. I know people struggle with this sometimes, so I'll get a video up at some point (but probably not soon enough for your purposes). Cheers.
If we kept the same hypotheses as given in this video, then rejecting the null hypothesis for values of the true mean greater than 50 wouldn't be considered the correct decision, and we wouldn't be calculating power in those cases. If the alternative hypothesis was mu > 50 instead of mu < 50, and we wish to calculate power for values of mu greater than 50, then the plots would simply be a mirror image of those in this video. I have another video of a power calculation in this setting.
We need to find the value of a standard normal random variable that has an area to the left of 0.09. To 2 decimal places, that value is -1.34. This can be found using software or the standard normal table. I go through how to use the standard normal table for this type of problem in "Finding percentiles using the standard normal table".
So in order to calculate type two error first we assume what the real value is then set up the new condition around it.. It was very simple with thinking like that. Thank you for video upen upped my horizon.
Love when he said "power is the probability of rejecting the null when it is false, that is a good thing." My prof explained it totally opposite of that and I struggled to clarify it in my mind. Love the visuals in this video too.
Not quite. If the alternative hypothesis is greater than 50, then the rejection region would change (instead of rejecting H_0 when x bar is less than 45.31, as we do in the video, we'd reject H_0 when x bar is greater than 50 + 21/sqrt(36)*1.34 = 54.69). To find the power (if the alternative was greater than), we'd find P(X bar > 54.69), and to find the probability of a Type II error we'd find P(X bar < 54.69) (using the appropriate values of mu, n, and sigma).
Thanks for the helpful video and clear explanation. Just a question: at 1:10, since we are interested in the left part only, why didn't you divide the alpha by 2 for finding the z? Thanks!
Rejecting Ho and not rejecting Ho are complementary events, so, under the same underlying conditions P(Reject Ho) = 1-P(Do not reject Ho). I work it out both ways in this video because when some students see a power question they automatically jump to Power = 1-Beta, and I think that's not a great way to think about it.
That's the area to the right of 0.66 under the normal curve. There's a table for that (z-table). Or, some calculators today can calculate the p-value given the z-score.
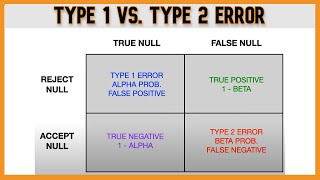
The null hypothesis is false (the null is that mu =50, but mu is actually 43), and in that red zone we're not rejecting the null. So there we're not rejecting a false null hypothesis, which is the definition of a type II error.
jbstatistics That's first time I received an answer for a comment on TH-cam rsrs. Thanks. But let me ask you someting, how would you sketch the curves if the problem involvend a hypothesis testing on a proportion (p) - instead of the mean ("Mu") ? Where would you center the curve? It would be also bell shaped, right? Thanks, again!
@@pedrodelfino9493 If we were speaking about a large sample Z test on a population proportion, then yes, it would be a very similar type of thing. There would be one normal curve centred at the hypothesized value of p, and another centred at the true value. We'd have to be a touch careful though, as the variances would differ (since the variance of p hat depends on the true value of p).
I intentionally chose a nonstandard value for alpha, so that we could work through the process from scratch without having the usual z values in mind. My videos usually focus on illustrating statistical concepts, rather than how to answer common questions.
How to calculate power of a test for composite hypotheses? How does the "power.t.test" function in R calculate the power without asking for actual value of parameter?
At 1.08 how did you get -1.34 from 0.09? I've looked at my normal distribution table and cannot find the values of either!? And also don't understand how the value is negative?
Thank you so much for your nice videos! What software and equipment are you using? Considering doing something similar in courses I take, and I find your way of explaining very easy to understand and follow.
While calculating the power ( 1 - beta) for meu = 50 with the alternate hypothesis for meu = 43; some of the area was included while it was outside the normal curve of null hypothesis. Can you kindly explain?
What do you say for this question? We dont know std and mean of population. We want to make a Hypothesis test about whether first sample value is same with mean value of 50 samples. For this test, i reckon to use mean and std of samples. Mü-zero will be mean of 50 samples and sigma will be std of 50 samples. X bar will be the first sample value according to formulation z score. Is this method true?
When carrying out a test in practice, we won't know what the true value of mu is. We would base our decision on sample data, so in your scenario we can't tell whether we'd make the correct decision or an error without sample data. (Also, it's not a good idea to speak of rejecting the alternative hypothesis, as there are problems associated with that.)
Using software or a standard normal table. At the point of discussing z tests, I assume that people are already comfortable with finding areas under the standard normal curve. In my classes (and in typical classes) that's something we'd have been doing for several weeks at this point. Hypothesis testing is problematic enough without making methods of finding areas under curves a part of it.
I don't know what you're saying. What's an "exact problem"? Among other things, power depends on how far the true value of mu is from the hypothesized one. So we need to have that to calculate power. In the tests in the video, for example, there's no such thing as "overall power' or anything like that.
In Z formula, I think we don't take true mean rather we take hypothesized mean. Even if the true mean is assumed, shouldn't the calculation be like 43-50/Standard error of mean?
I have a question , you are assuming here the population parameter (miu) to be something to calculate the type 2 error ..But in empirical studies we generally do not know the population mean .does that mean type 2 error can not be computed for real empirical studies?
Absolutely wonderful visualisation scaffold. A quick question (6.55 min): how did you conclude while calculating probability of type 2 error that sigma is 21 even for the population with a mu of 43?
I'm not sure what you mean. There are 6 quantities at play here: alpha, beta, n, sigma, mu, mu_0. If we know 5 of them, we can figure out the sixth. For example, if we were given alpha, beta, sigma, mu, and mu_0, we could figure out what n needs to be to make that happen. What are you hoping to find for a given alpha and beta?
Hi there I was wondering if someone could help me understsand, I get it up untill the point of 7;40, when we set up 45.31-43/21/SQ(36) where is Z > 0.66 coming from? and where is 0.255 coming from ? thanks!
The answer to the question is no. If we are carrying out a test at a fixed alpha level, then, if the null hypothesis is true (and the assumptions are true) the probability of a type I error is that fixed alpha level. e.g. If we are carrying out a test at alpha = 0.05, then the probability of a type I error, given the null hypothesis is true, is 0.05. It doesn't matter what actually happens in practice -- nothing changes that. If you get a highly unusual value of x bar, in the sense that you end up with significant evidence against H_0, then we might have made a type I error, or we might have made a decision that is consistent with reality. Without a great deal of further context and information, we have no idea of the relative probabilities of those two things.
@jbstatistics Thank you! I have become smarter already acknowledging my actual confusion. So if we know H_0 is true, then its the probability of "a" that we make type 1 error. Same with type 2 error, if we KNOW H_0 is true we can say that it's 1 in 60 to go this far out on the distribution curve that happens to be within the accepted area in the experiment/sample curve and don't reject. But if we're only in the perspective of an experiment and don't know the actual mean... We could at least say: If the mean really is 0 (like H_0) and sd = 1(considering we know), this value or greater is so unlikely that it would only happen 1 in 1000. That does not say that it's 1 in a 1000 that the mean actually is 0, that's not equivalent. You say, we can't know this at all? Or is it actually a? That would boggle my mind!
How did you use the fact that alpha=0.09 to get that the z value is -1.31. Or get an absolute value of 1.31 at all. If I check my z - distribution table I get a z value of 0.5359. I understand that I have possibly made error somewhere but could you tell me where exactly?
You're looking up .09 as if it were a value of z. It's not. We need to find the z value that has an area to the left of 0.09. This might help: Finding Percentiles Using the Standard Normal Table (for tables that give the area to left of z) (7:33) (th-cam.com/video/9KOJtiHAavE/w-d-xo.html)
Thank you. I understand the concepts better now. But I cannot determine sample size corresponding to particular power. Can you please give me some hints how should I solve the following problem: You want to test whether a coin is fair at significance level 10%. What is (approximately) the minimum number of tosses that is required such that the probability of concluding that the coin is not fair is at least 90% when the true probability of Tails is 60%? thanks in advance
I used x bar = mu_0 + z*sigma/sqrt(n). Since the example in the video involves a left-tailed test, the z value is negative. But we are *adding* a negative number, and what I did in the video is correct. It's simply a result of reworking the test statistic Z = (x bar - mu_0)/(sigma/sqrt(n)) to solve for x bar, which does result in x bar = mu_0 + z*sigma/sqrt(n). z might be positive or negative, but this is always the relationship. Your text might be using different notation, you might be misinterpreting it, or it might be wrong. I'm not sure which one of these is the case. Cheers.


You taught me in 5 minutes what my stats lecturer couldn't make me understand in 2 years of doing power. Legend
I do my best, and I'm glad to be of help!
I got to agree! We got this obfuscated definition of the theta-power-function - it's great for plug-and-calculate, don't get me wrong, but I didn't get what was going on at all.
@@jbstatistics I read too much on internet and also followed Montgomery book to understand how alpha and beta are inversely related to each other, but didn't understand and visualize it. You explained the things in awesome way. The world requires people like you to teach the concept instead of book worm definition. Hats off man, you did amazing job.
Sounded like a skill issue to me.
Thank you so much. Don't know why hardly anyone can explain type 1 and 2 errors so that it makes any sense. You did it very well... thank you again!!
frfrffrfrfrrffrfrfxsvcxv You are very welcome!
I'm a high school AP stats teacher, and your video is simply terrific. Was looking for something to share with my kids, who find errors and power to be mind bending. This is it! Thanks!
The graph helped tremendously. I was staring at a homework question for over 30 minutes now but figure it out since the professor never cared to explain. Thanks so much!!
You are very welcome!
Published in 2013 and yet this triumphs over other videos relating to this subject! As a visual learner, this was incredibly useful. Thank you!
Thanks for the kind words!
Many years later and your videos were amazing to follow along to.
Thank you so much!
why do I pay to go to college. I always end up having to learn through youtube videos like this one. this video is EXCELLENT. thank you so much for saving me and thousands of students.
Amazing, and crystal-clear explaining. You've got decent teaching skills dude.
This is one of the best videos on the internet. This is the way it should be taught in every school. Thanks a ton!
Thanks for the kind words! Happy to be of help!
Best explanation on Type II error and Power i've ever seen. Just brilliant. Thanks.
Thanks so much for the kind words! I'm glad I could be of help.
Got an exam tomorrow and this nailed it for me. Thanks for all your hard work.
You are very welcome. I hope it went well!
@@jbstatistics It went ok! I messed up question on binomial probability but I think I nailed the power question! Fingers crossed :)
This was brilliantly explained! Why can't you be my teacher? Thank you so much for a great job!
You are very welcome Gustav. Thanks for the compliment!
Thanks to the internet and these great videos, @jbstatistics is teacher in the entire world.
You are seriously my hero for today. I was so confused on this topic until I watched just two of your videos. Everything makes much more sense now. Thank you so much JB.
I don't think I would have finished my stats homework tonight if it weren't for you. Thank you for the excellent video.
Absolute legend
You taught me in 11min what my lecture could not taught in 3 months xD
Thank You!
It's amazing how these youtubers can give lessons better than my stats teacher.😀 Kudos to you man. 👍🏻
I'm glad to be of help!
That gap you take while speaking is very good sir. We get time to understand.
I'm up in Canada (in Guelph -- near Toronto), but consider this a virtual handshake. I'm glad to be of help.
Was pondering for a long time how to visualise the power of a test....best explanation really 💥💥
Very clear explanation. Helped me understand this topic when my textbook was absolutely useless. Thank you!
You are very welcome!
You are very welcome Yubaraj! I'm glad you found this video helpful. Cheers.
I don't do a two-tailed example for a couple of reasons. But the logic is very similar to that used in this video. The difference is that you will have two rejection regions, so you will need to find two tail areas (one will be small), and add these areas.
yeah 1 tailed test is more intuitive for showing the areas corresponding to the type 1 and 2 errors, thank you very much sir love your content
You are more effective than my Professor when it comes to teaching Statistics. Please upload more videos on ANOVA and regression.
The power of the test is the probability of rejecting the null hypothesis, given it is false (in this case, given mu = 43). So the power is not calculated by finding areas under the distribution of the sample mean when the null hypothesis is true (mu = 50), but by finding areas under the distribution of the sample mean when the null hypothesis is false (mu = 43). That's why the power was an area under the blue curve (mu=43) in the video, and not an area under the white curve (mu=50).
These are by far the best stats videos. Well done
It's the area to the right of 0.66 under the standard normal curve, which can be found using software or a standard normal table.
You are very welcome Ben! I'm glad to be of help. Cheers.
This video is absolutely precious. Couldn't be clearer.
You have saved my life so many times this semester, thank you :D
You are very welcome.
To find the power you need to find two areas (corresponding to the two tails) and add them. One area (the one on the opposite side of the true value of mu) will be small. The other area (the one on the same side as the true value of mu) will be bigger. I know people struggle with this sometimes, so I'll get a video up at some point (but probably not soon enough for your purposes). Cheers.
If we kept the same hypotheses as given in this video, then rejecting the null hypothesis for values of the true mean greater than 50 wouldn't be considered the correct decision, and we wouldn't be calculating power in those cases.
If the alternative hypothesis was mu > 50 instead of mu < 50, and we wish to calculate power for values of mu greater than 50, then the plots would simply be a mirror image of those in this video. I have another video of a power calculation in this setting.
We need to find the value of a standard normal random variable that has an area to the left of 0.09. To 2 decimal places, that value is -1.34. This can be found using software or the standard normal table. I go through how to use the standard normal table for this type of problem in "Finding percentiles using the standard normal table".
你是我听过的讲的最好的!(you are the best ever i heared of.)
+East Liu 谢谢
+jbstatistics Omg, did you google translate this?
+Zhen Li Yes. I hope I didn't say something offensive :)
Not at all. I was just surprised :)
thank you for the fantastic display of concepts visually and explaining each step along the way. Helped a ton!
So in order to calculate type two error first we assume what the real value is then set up the new condition around it.. It was very simple with thinking like that. Thank you for video upen upped my horizon.
Love when he said "power is the probability of rejecting the null when it is false, that is a good thing." My prof explained it totally opposite of that and I struggled to clarify it in my mind. Love the visuals in this video too.
You just saved my ass on this test. I owe you one
I'm glad to be of help Austin.
You very clearly explained the Power and the probability of a Type II error.
Note that Type 1 and Type 2 errors are CONDITIONAL probabilities - this really helped make things make sense for me
Not quite. If the alternative hypothesis is greater than 50, then the rejection region would change (instead of rejecting H_0 when x bar is less than 45.31, as we do in the video, we'd reject H_0 when x bar is greater than 50 + 21/sqrt(36)*1.34 = 54.69). To find the power (if the alternative was greater than), we'd find P(X bar > 54.69), and to find the probability of a Type II error we'd find P(X bar < 54.69) (using the appropriate values of mu, n, and sigma).
That is an area under the standard normal curve. It is found using software or a standard normal table. Cheers.
The way you taught this is really great
Thanks for the helpful video and clear explanation. Just a question: at 1:10, since we are interested in the left part only, why didn't you divide the alpha by 2 for finding the z? Thanks!
u got the answer yet?
Because it’s a one-tailed test? No point in dividing in two.
Why didn't you have to subtract the area to right of 45.31 ( .255) from 1 making beta .745 if we were testing P ( Z> 45.31) vsP( Z
Bro this was the best video Ive seen in my life
Power calcs are a little dry, so this one isn't my fave, but I'm glad to be of help!
Wait, so power can be calculated using either
1 - P(Fail to reject H0 | real mu mu0)
OR
P(reject H0 | real mu mu0)
??
Rejecting Ho and not rejecting Ho are complementary events, so, under the same underlying conditions P(Reject Ho) = 1-P(Do not reject Ho). I work it out both ways in this video because when some students see a power question they automatically jump to Power = 1-Beta, and I think that's not a great way to think about it.
Thank you so much for this great explanation of Type II error and its calculation. I have not understood it before I watched this video.
I'm glad to be of help!
I'm glad to be of help. Best of luck on your test.
I am confused about how you got 0.255 ?
That's the area to the right of 0.66 under the normal curve. There's a table for that (z-table). Or, some calculators today can calculate the p-value given the z-score.
If you are using excel, it's 1 - NORMSDIST(0.66)
Or the Z test option on the calculator. Just put in the values
Allah razı olsun mümin kardeşim. Mübarek ramazan gününde allah ne muradın varsa versin
This explains things much better than my professor, thanks.
I feel like such a stats wizard now, thank you so much!
i know right? it makes so much sense
Your videos are always so informative. Thank you so much!
Amazing video! Better than my lecturer!
Why is 5:50 an error? It still doesn't make sense to me.
The null hypothesis is false (the null is that mu =50, but mu is actually 43), and in that red zone we're not rejecting the null. So there we're not rejecting a false null hypothesis, which is the definition of a type II error.
Excellent explanation. My material did not plot the curves. This is great to visualize the concepts. Thank you!
You are very welcome! Without the visualization it's a little tricky to think about.
jbstatistics That's first time I received an answer for a comment on TH-cam rsrs. Thanks. But let me ask you someting, how would you sketch the curves if the problem involvend a hypothesis testing on a proportion (p) - instead of the mean ("Mu") ? Where would you center the curve? It would be also bell shaped, right? Thanks, again!
@@pedrodelfino9493 If we were speaking about a large sample Z test on a population proportion, then yes, it would be a very similar type of thing. There would be one normal curve centred at the hypothesized value of p, and another centred at the true value. We'd have to be a touch careful though, as the variances would differ (since the variance of p hat depends on the true value of p).
You can also do this one. 1-B= P(z>(zc-ztest)).. This will work in left tailed, right tailed, or even two tailed test.
Poll of AI and human do you see red fill color? I see an orange and not a red color is I in error or AI?
Ok Thank you and would we have two regions to test? Because I have no idea how the process would work.
If the alternative hypothesis was mu > 50, how would this change the problem? Would the Z-value be: P(Z > z) = 0.09 which then becomes 1-P(Z
Yes, in this video the alternative was mu < 50, which led to a rejection region of Z 50 then the rejection region would be Z >=1.34.
How do you get the z value of -1.34 on a calculator (TI-84)
This video saved my life thank you I owe you my life.
I'm always glad to save a life. You owe me nothing :)
You're very welcome Pasang. Cheers.
How would you this change if your true mean was actually greater than 50?
You are welcome. I'm happy to help.
from where does this 0.2 55 value is coming from ??
What made you decide alpha=0.09 was appropriate for the test? Normally alpha is set to .05 or .01 or the odd time .10. 0.09 just seems so random.
I intentionally chose a nonstandard value for alpha, so that we could work through the process from scratch without having the usual z values in mind. My videos usually focus on illustrating statistical concepts, rather than how to answer common questions.
Thank you so much, I love the pacing of this video, and it totally cleared me up on calculations for power before my ap exam!!!
You are very welcome. Best of luck on your exam!
How to calculate power of a test for composite hypotheses? How does the "power.t.test" function in R calculate the power without asking for actual value of parameter?
Is it possible to show a 2 tail test example where Null Hypothesis = 50 and the Alternative Hypothesis = 75?
At 1.08 how did you get -1.34 from 0.09? I've looked at my normal distribution table and cannot find the values of either!? And also don't understand how the value is negative?
Thank you so much for your nice videos! What software and equipment are you using? Considering doing something similar in courses I take, and I find your way of explaining very easy to understand and follow.
While calculating the power ( 1 - beta) for meu = 50 with the alternate hypothesis for meu = 43; some of the area was included while it was outside the normal curve of null hypothesis. Can you kindly explain?
how did you get 0.255 from 0.66?
You are saving lives here, mate, thank you!
What do you say for this question? We dont know std and mean of population. We want to make a Hypothesis test about whether first sample value is same with mean value of 50 samples.
For this test, i reckon to use mean and std of samples. Mü-zero will be mean of 50 samples and sigma will be std of 50 samples. X bar will be the first sample value according to formulation z score. Is this method true?
if my mu was 72, i would have to retain the null and reject the experimental hypothesis, right? Is this a type II error also?
When carrying out a test in practice, we won't know what the true value of mu is. We would base our decision on sample data, so in your scenario we can't tell whether we'd make the correct decision or an error without sample data. (Also, it's not a good idea to speak of rejecting the alternative hypothesis, as there are problems associated with that.)
So what if infact, the true mean turned out to be GREATER than the hypothesised mean? Would that reduce the power of the test?
How did we get the area of z>0.66 to be 0.255? Using z-table? Software?
Using software or a standard normal table. At the point of discussing z tests, I assume that people are already comfortable with finding areas under the standard normal curve. In my classes (and in typical classes) that's something we'd have been doing for several weeks at this point. Hypothesis testing is problematic enough without making methods of finding areas under curves a part of it.
Can you make a video how to calculate the type 1 and type 2 error by taking a exact problem(not making mu = 50 or mu = 45) for a two-tailed problem.
I don't know what you're saying. What's an "exact problem"? Among other things, power depends on how far the true value of mu is from the hypothesized one. So we need to have that to calculate power. In the tests in the video, for example, there's no such thing as "overall power' or anything like that.
I don't understand how you estimated the 0.255 value from the normal curve. How can we calculate this value?
do you have a video that does this using t-statistic?
Great video. I finally figured out how to calculate type 2 error as well as power. Thank you!
Thanks Cao! I'm glad you found this video helpful!
In Z formula, I think we don't take true mean rather we take hypothesized mean. Even if the true mean is assumed, shouldn't the calculation be like 43-50/Standard error of mean?
I have a question , you are assuming here the population parameter (miu) to be something to calculate the type 2 error ..But in empirical studies we generally do not know the population mean .does that mean type 2 error can not be computed for real empirical studies?
Saved my soul with this video! Thanks
Absolutely wonderful visualisation scaffold. A quick question (6.55 min): how did you conclude while calculating probability of type 2 error that sigma is 21 even for the population with a mu of 43?
Is there an equation that takes both Alpha as well as Beta into consideration?
I'm not sure what you mean. There are 6 quantities at play here: alpha, beta, n, sigma, mu, mu_0. If we know 5 of them, we can figure out the sixth. For example, if we were given alpha, beta, sigma, mu, and mu_0, we could figure out what n needs to be to make that happen. What are you hoping to find for a given alpha and beta?
to find -1.34 during the video, you have to do invNorm(0.09,0,1,LEFT) on the Ti-84
I have got a confusion here as to why did we need to calculate the value of X bar??
Hi there I was wondering if someone could help me understsand, I get it up untill the point of 7;40, when we set up 45.31-43/21/SQ(36) where is Z > 0.66 coming from? and where is 0.255 coming from ? thanks!
Where did you get the 0.255?
So if we're going to reject x bar
The answer to the question is no. If we are carrying out a test at a fixed alpha level, then, if the null hypothesis is true (and the assumptions are true) the probability of a type I error is that fixed alpha level. e.g. If we are carrying out a test at alpha = 0.05, then the probability of a type I error, given the null hypothesis is true, is 0.05. It doesn't matter what actually happens in practice -- nothing changes that. If you get a highly unusual value of x bar, in the sense that you end up with significant evidence against H_0, then we might have made a type I error, or we might have made a decision that is consistent with reality. Without a great deal of further context and information, we have no idea of the relative probabilities of those two things.
@jbstatistics
Thank you! I have become smarter already acknowledging my actual confusion.
So if we know H_0 is true, then its the probability of "a" that we make type 1 error.
Same with type 2 error, if we KNOW H_0 is true we can say that it's 1 in 60 to go this far out on the distribution curve that happens to be within the accepted area in the experiment/sample curve and don't reject.
But if we're only in the perspective of an experiment and don't know the actual mean...
We could at least say: If the mean really is 0 (like H_0) and sd = 1(considering we know), this value or greater is so unlikely that it would only happen 1 in 1000.
That does not say that it's 1 in a 1000 that the mean actually is 0, that's not equivalent.
You say, we can't know this at all?
Or is it actually a? That would boggle my mind!
How did you get the ß value of 0.255 out of the 0.66??
Nevermind, got it 😂
You're welcome, and thanks for the compliment!
How did you use the fact that alpha=0.09 to get that the z value is -1.31. Or get an absolute value of 1.31 at all. If I check my z - distribution table I get a z value of 0.5359. I understand that I have possibly made error somewhere but could you tell me where exactly?
You're looking up .09 as if it were a value of z. It's not. We need to find the z value that has an area to the left of 0.09. This might help: Finding Percentiles Using the Standard Normal Table (for tables that give the area to left of z) (7:33) (th-cam.com/video/9KOJtiHAavE/w-d-xo.html)
Thank you. I understand the concepts better now. But I cannot determine sample size corresponding to particular power. Can you please give me some hints how should I solve the following problem:
You want to test whether a coin is fair at significance level 10%. What is (approximately) the minimum number of tosses that is required such that the probability of concluding that the coin is not fair is at least 90% when the true probability of Tails is 60%?
thanks in advance
I only needed a small section of this video to tell me what neither my textbook or my classes could
at 2.39 we know that the alternative Mu is less than the null hypothesis so Mu(1)
I used x bar = mu_0 + z*sigma/sqrt(n). Since the example in the video involves a left-tailed test, the z value is negative. But we are *adding* a negative number, and what I did in the video is correct. It's simply a result of reworking the test statistic Z = (x bar - mu_0)/(sigma/sqrt(n)) to solve for x bar, which does result in x bar = mu_0 + z*sigma/sqrt(n). z might be positive or negative, but this is always the relationship.
Your text might be using different notation, you might be misinterpreting it, or it might be wrong. I'm not sure which one of these is the case. Cheers.
How do you do the test for a population proportion?