Hypothesis Test - Mean | μ | p value | z-table + Examples

ฝัง
- เผยแพร่เมื่อ 20 ก.ค. 2024
- How to conduct hypothesis test for a population mean μ using p-value approach assuming the population standard deviation (sigma) is known.
P-value from Student's t-Table: • P-value from t-table |...
Hypothesis Test for p (proportion): • Hypothesis Test for Pr...
00:00 - Introduction
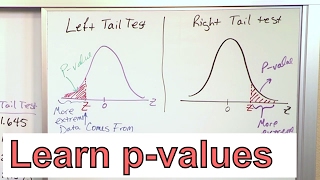
00:30 - Left-tailed test
01:22 - P-value
03:53 - 2-tailed test
04:50 - Right-tailed test
05:50 - Two-Tailed test


Perfectly explained. Through all my stats classes I've just been plugging in the numbers, unable to visualize it, so I always forget. No one has ever been able to explain it this well. Thank you
My pleasure, Tanya. Glad it helps.
Yes, this guy made it so easy !! I teach stats for junior college, and this guy just increased my already-existing impostor syndrome lol
Haha, you're funny, Abi. 😄 Thanks for dropping a note.
Thanks, Joshua. This is a great video
Great video, thanks!
I love your videos and your way of explaining is really good i would like to request you one thing how many Z-table we have to see z scores? because i got confuse can u please make a video on that? thanks alot for your videos
I'm not really clear about your question. Are you working with a different z-table?
Thanks Joshua!
Good explanation 👍
I don' know why this video is not getting more likes
True
Man thanks 🙏🏿 you saved me
Nice explanation thanku
Morning sir, thanks for the lecture.
My question is on what base, do we attribute a level of significance ("LS") to a hypothetical question?
For instance for a sample we do a hypothesis testing for this two: "LS" = 0.01 and another at "LS" = 0.05
We can have the following results:
for a "LS" = 0.01 we fail to reject the null hypothesis, for a "LS"= 0.05 we do reject the null hypothesis...
So it can lead to an error in conclusion of the experiment?
So how do we choose our "level of significance "?
Thanks.
Significance level (alpha) is the probability of making a Type I error.
If you choose alpha = 0.05, you’re saying that your conclusion is prone to Type I error, 5% of the time.
That is, you will likely reject the null hypothesis (when it is actually true) about 5% of the time.
But if you choose alpha = 0.1, you have increased your chances of rejecting a true null hypothesis to 10%.
Factors such as sample size and practical implication could also inform the choice of alpha.
This guy in this video: th-cam.com/video/OH2pr0qMom8/w-d-xo.html tries to answer your question but in general.
if only I had seen this good lecture before hmm. but it's too late i have to face the exam in 30 mins from now.
Thanks
perfect
Very well explained.
Glad you like it, Harsh.
Please im confused. Why did you minus 1 from the value you get from the table in the right tail test but didn't do so in the left tail test?
The Z-table I used shows areas below Z. If you want areas above, you have to subtract from 1.
thank you siiiiiir
Hi Joshua , I'm confused about your last example, why have you subtracted minus one in the 2 tailed test when the claim does not suggest a right-tailed test?
The table (or Excel) usually gives you the left-tail area. Since the test statistic is positive, you need to do "1 minus" to obtain the right tail area first, then multiply it by 2 for the two-tailed test.
If the test statistic were negative, you don’t need to do “1 minus” to obtain the area in the left tail because the area in the table is already left-tailed.
@joshemman sır does these "1 minus" work in the p values population only or in all hypothesis testin because i have not seen you minusing 1 in your other videos of hypothesis testing...
🎉🎉🎉
[Edited] I do have a question. Do we have to multiply p-value with 2, for 2-tailed tests? I'm having a hard time wrapping my head around this.
Yes, we have to multiply one-tail area by 2 to obtain the p-value for a two-tailed test.
Hi joshua, why did you use pvalue 0.0344 in your last example when it is a 2-TAILED test ? I thought you only subtract 1 from the value in the table when it is right tailed test?
At 6:06, the one-tail area was multiplied by 2 to obtain p-value of 0.0688.
Thanky so much bro 💫💫💫all queries solved
You're welcome, Zainab.
hey Emmanuel in two tail test you are testing for differ from mean @ signi level .05 means it will be rejected only if value = .05
but you are rejecting it when value < .05 why?
Hi Arun, you reject Ho when p-value < alpha.
@@joshemman why are you rejecting Ho when p value
@@Arun-qu2sf That's by definition but watching the video a few more times might help.
@@Arun-qu2sf at that area the test is significant enough...
How did you get the 4.9 from the alpha of 0.01
That symbol σ is sigma (not alpha). It represents the population standard deviation.
P value table?
Wow😮😮😮🎉🎉🎉
5:30
I thought the alpha has to be divided by 2 when working with the 2 tailed hypothesis?
Yes, it is alpha/2 for "each" tail in two tailed tests. This is why the one-tail area is multiplied by 2 to obtain the P-value for a two tailed test.
@@joshemman Doesn't the stated p-value already account for that? (I have also asked this question as a separate comment)
@@abiofficial-ws7pn If your p-value is from a software like R, then it is 2-tailed by default, unless you specify 1-tail. If you manually calculate p-value as done in this video, you have to multiply the one-tail area by 2 for two-tailed tests.
😁😁😁😁😁😁
How're you Mr Joshua,where can we get your email address?
You can just ask your question here.
@@joshemman do you do tutorials for specific topics/assignments
@@chantellechikukwa7488 Sure. What are you working on?
@@joshemman Operations Management and Analytics
@@chantellechikukwa7488 Do a Google search. You should find my contact email. I can't post here.