Testing the Assumptions for Pearson's R in SPSS

ฝัง
- เผยแพร่เมื่อ 5 ก.ย. 2024
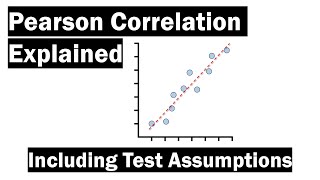
- This video demonstrates how to test the assumptions for the Pearson’s product-moment correlation coefficient in SPSS. The output from the assumption testing, including a scatterplot, is interpreted and Pearson’s r is calculated.


![🎤 ไปกันต่อออ! จับฉลากร้องเพลง x P’ #XXSIVK [EP.2] (1/2) เพลงของใครจึ้งสุดน้าา 💓🎤 #MXFRUIT](http://i.ytimg.com/vi/mLI_K0sAS4o/mqdefault.jpg)


Love your videos thank you so much for taking the time. They are very clear and informative. Please could you do a video on what to do if the assumptions are not met?
Fantastic video! Please keep going, one day you make it big
Thank you -
Please , needing an answer, you still run pearson r even after normality violation ! So if one variable or both are non parametric (not normality distributed), can we go further and use pearson or used spearman
Do we still run Pearsons r if the assumptions have not been met?
Thanks for the great video. Does the normality assumption apply only to the dependent variable? That's what a few other sources seem to state.
Hi Dr. Todd Grande, can I ask a question please? I am conducting a study with 4 independent variables and 3 dependent variables. To present the figures in APA7 format, is it acceptable to present 12 scatterplots separately, figures 1-12 and describe each relationship or should I instead refer to the figures in the appendix- spss output? Thank you
Nice video Todd.
Thank you -
Good job.
Thankyou so much