Operations Management: Forecast Errors (MSE, MAD, MAPE)

ฝัง
- เผยแพร่เมื่อ 27 ส.ค. 2024
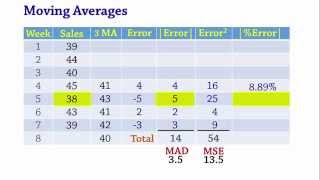
- This video demonstrates how to set up a quick table in Excel to calculate common forecast errors including Mean Squared Error (MSD), Mean Absolute Deviation (MAD), and Mean Absolute Percentage Error (MAPE)


Thank you! Studying for CPIM and your videos have been extremely helpful in bringing the boring text books to life.
Glad you like them!
have a OM 300 final today and I understand how to do most of the math but just wanted to watch someone do it again and these really help thank you
You’re very welcome! I hope the exam went well.
Thank you for this explanation
You are welcome!
Hi, is it only for one item for each calculation of forecast errors or for various items?
Hi there. You want to calculate errors for all times to develop a true mean. You could exclude large outliers however, based on professional judgment.
Instead of satisfaction scores if you were calculating sales data would this be the same approach? Thank you
Hi Olivia, that's right! You can use this to forecast just about anything!
Hi, thanks for all you do here. Question, how do I set up an Excel sheet for the three period running averages? Any help is greatly appreciated! Have a great day!
All you want to do is create a formula that calculates the average of the previous 3 periods. For example if your data for the past 3 months is in cells A1, A2, and A3 then the forecast for month 4 is: AVG(A1:A3). Then copy that formula down each period and the cells should update automatically as actual data is included in cells A4,A5, etc.
MAPE % will be low it means our forecasting is good? Or bad?
Good question. From the MAPE you can sort of really assess if the forecasting is “good” or bad per se. The it’s the average absolute percentage error which means that the forecast is “off” by the MAPE and that could mean over or under relative to the actual demand. It’s the size of the MAPE that’s important. For example if the MAPE is 5% then we can say the forecasts differ from actual demand by an average of 5% which is not very much in many cases since you would expect some differences. If, however, the MAPE is 15% that might not be acceptable because the higher the MAPE the less reliable the forecast is.
Hope this helps.
@@The_Business_Doctor understand your point. One more thing to ask- how we can increase our projection accuracy, is there another technique or methods?