The Sampling Distribution of the Sample Mean (fast version)

ฝัง
- เผยแพร่เมื่อ 25 ก.ย. 2012
- I have a slightly slower and more refined version of this video available at • The Sampling Distribut... .
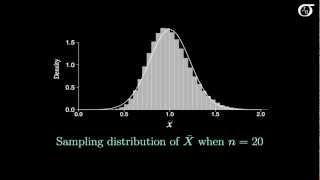
I discuss the sampling distribution of the sample mean, and work through an example of a probability calculation. (I only briefly mention the central limit theorem here, but discuss it in more detail in another video).


I don't understand why my lecturer can't explain without everyone being confused when this guy can do it half the time and I totally understand him
Kristian Veljanoski Exactly!!! I have the same sentiments
Typically, a lecturer is "lecturing" at someone. That implies that "someone" is the recipient of stern criticisms being delivered by the lecturer. The gentleman speaking in this video is teaching/educating. Yes, technically, we can define his speaking as a "lecturing". He is lecturing. For whatever reasons, when I was young, my mom instilled (indirectly) into my understanding, that a "lecture" is a punishment. Mr. JB is sharing information. He is teaching. Those concepts carry "positive" connotations. JB's last words in the video are "...but I would be remiss, if I didn't at least mention it here". He had just suggested that we view another of his videos so that we learn something. Obviously, this JB is a quality human being who cares enough about his reputation, the quality of his presentation, and about virtues such as forthrightness and honesty to point out that the omission of a related concept would be a dishonest action for him to make. Now, take a company such as,,... hmmm... say... Pearson Education. They operate in a completely different fashion, and generally, without concern for whether a student is actually being positioned to learn the material that she/he is lead to believe that she/he will be learning. Check with your "lecturer"; who publishes the textbooks you are using? If it's Pearson Education, God help you... I sincerely sympathize and empathize with your situation. Alas, I can't change your situation (I would, if I had that power). In a nutshell: you are fucked. You've already lost and the rest of your conscious life will be a serious of false hopes. Pearson is disgusting. This is the Hunger Games aftermath...pun very much intended. Pearson takes all of the unlucky ones and uses them as lab rats. fuck...
Totally agree
I fully agree! I know my instructor is foreign and a Graduate Student but this is the best explanation for that section.
Exactly!!, Thanks a ton,🤝👍
I love the oration, it's like watching a trailer for STATISTICS - THE MOVIE: 2 - THE SAMPLE MEAN ESTIMATES THE TRUTH.
At that point we're looking to find the probability that the random variable Z takes on a value that is bigger than or equal to 1. That is the area under the standard normal curve to the right of 1. This can be found using software or a standard normal table. I have videos on finding areas using the standard normal table, and they can be found in my "Using a standard normal table" playlist. I don't discuss that aspect in this video, as it's already been discussed previously. Cheers.
You are amazing and you have no idea how much it means to me that I finally found a video that makes me UNDERSTAND what an entire semester course online hasn't. I also love listening to you!
You have the best explanations out of all the stats channels. I know if I go to your channel you will help me get the gist of the basic concept without overloading me like Khan Academy does.
I'm just doing my part to spread the joy of poutine throughout the world. But I'm not to be blamed for any negative health implications!
you're brilliant
Absolutely entertaining!
You're the best statistics teacher on youtube. Thanks!
Awesome channel. Taking a regression analysis course as an elective and completely lost. It’s been so long since I’ve take a stats class , but these have all been the perfect crash course review I needed.
Thanks! I'm glad to be of help!
missed my statistic class about this topic and seeing this just helps me catch up with them ASAP. thanks a bunch my good sir. its soo easy to understand
You are welcome. I'm glad you found it helpful.
You're welcome sucreeh, I'm glad to be of help. Thanks for the compliment!
Couldnt find such a good and simple explanation written in the books... Thank you!
You're welcome Ivan, and thanks very much for the compliment!
Okay, this dude deserves a high applause because he explained it better than my teacher. Thank you so much🙇
doing gods work thank you still useful 11 years later
You are literally the only reason that I understand my Business Statistics homework for each week.
Thank you for the video, one question Where do you get 0.0013? my Z-table show me in -3.00 and in the video is positive 3.
for the rest I understand the concept.
Thank you again.
These 7 minutes saved my life thanks
How do you do these calculation on a calculator, say a TI-83/TI-83 Plus? ( refering to finding the area under the curve at 4:08 in the example)
Thank you! And thank you for the enthusiasm, it makes it a lot more enjoyable to study.
it scares me when you yell. but you did dumb it down for me so thank you
You can find that from the standard normal table or using software. I have videos on using the standard normal table if you need help with that.
really like the length of these videos, he's like the more advanced statistics version of khan
I have a test on this tomorrow. I am so glad I found this video! Helped a ton :)
I'm glad to be of help Katrina. Good luck on your test!
In 20 minutes I will be seated taking my last probability and statistics test! I didn´t know much about sampling distribution but now in a few minutes I understand it fairly well.
I'm taking the time to sign in and thank you.
I hope your test went well!
Excuse me @JB, at 4:03 from where did you get the value of 0.159? Sorry I got lost there. It's not on my Z table. Thanks for answering
Love the pace and your voice.
Does this same approach apply to solving for y?
cant thank you enough
nice, simple, and clear unlike the other ones. Thanks!
You are very welcome. Thanks very much for the compliment!
You're welcome! I'm not a big fan of the whole concept of overpriced textbooks. Just doing my small part of being part of the solution.
hi, how did you get 0.159 at video time 4.12
If z value,meu value,sigma value,and also n value. So how to find x bar value. Plz tell me
What is the name of the video in which you explained how we can get the relation between the deviation of the sample and the population deviation? It’s actually a bummer that I haven’t found out about your videos until now. Thank you so much!
I didn't exactly get what does X bar mean, could somebody clarify that for me? thankssss!
this helped me SO SO SO SO SO much
I get it now, thank you!!
Where do you find 0.159 on minute 4:13 ?
Whats is normal vs approximately normal vs not normal and how do i tell?
6:02 Can you always deduce the standard error (SD of the sampling distribution of the sample mean) for any given sample size, if you know the population mean and SD?
The theoretical SD of the sampling distribution of the sample mean is sigma/sqrt(n), as long as we are sampling independently from the population. If, say, we are sampling without replacement from a finite population, then it's a little different as the observations are correlated and we must incorporate a finite population correction factor. (But if the population size is very large relative to the sample size then that makes very little difference.)
About the P(X > any value), wouldn't it be 1 - P(X < any value) to calculate it?
Thanks so much for posting this, very clear and helpful.
For the first example, how come you did 760 instead of 759.5? How do u know when it is a normal approximation?
How do you calculate for the probability that the mean will be exactly a certain value? (Not a range like less than, more than or in between)
P(z="value")
Your voice over is awesome. Make it more interesting to listen to compare to my Asian lecturer.
Thanks Abhishek!
I meant to ask this specific question in another video. I think I wasn’t clear enough. If you create a 100 by 30 standard normal matrix and then find the average of each row, now you have 100 by 1 matrix of 100 row means or a vector of 100 means. How do you find the the variance of the mean of the 100 means theoretically?
I'm not sure what you mean by "standard normal matrix." If you mean simulated values from a standard normal distribution, then the variance of those 100 means could be anything greater than 0. On average it would be just the variance of the sample mean of 30 observations, which is sigma^^2/30, as discussed in this video. But on any given simulation it could be anything.
If you mean theoretical standard normal random variables, such that we've got a 100 x 30 matrix of 3000 standard normal random variables, then the question as posed doesn't really work. It's essentially asking "what's the variance of 100 sample means?", where each sample mean is a random variable with a variance of sigma^2/n (which is 1/30 in this case). We'd need to have some function of those sample means in order to have something to work with.
Repeated sampling is a conceptual thing that sometimes helps us understand what we mean by a sampling distribution. But here I think your use of 100 means is confusing the issue more than anything. The variance of the sample mean is sigma^2/n. If we sampled 30 values independently from the standard normal distribution, the variance of their mean is 1/30. If we sampled repeatedly and got any number of means of size 30 in this fashion, *on average* the variance of those sample means would be sigma^2/n = 1/30. It doesn't matter how many times we repeated sample*, what matters is how many values we were averaging to get each mean.
*The more means we sampled, then lower the variance of the sampling distribution of their variance would be, and the more tightly grouped that distribution would be about sigma^2/n. This starts to get a little messy to think about, which is why I think it's best to leave the number of means sampled out of the equation, and simply recognize that the variance of the sample mean is sigma^2/n. This means if we were to repeatedly draw samples of size n, get a mean for each sample, and keep doing that a very large number of times, the variance of those sample means would be sigma^2/n.
This is gold- 8 years ago wow
You keep saying that you are doing your small part to help others understand Probabilities and Statistics. However, your contribution is in NO WAY a small one. You and thankfully my Statistics Professor at the college I attend, have the wonderful gift to teach so many to understand how to apply these math processes and procedures. Can you do the same with Algebra (yeech!!!)?
Very nice. Thanks for making this.
how about if the question aSK less than?
Exam in three days and finally the penny drops. Thanks heaps man!
You are very welcome Rick. Best of luck on your exam!
You are very welcome!
Thank you so much for directing me to this. I am going to keep looking through more of these videos so I can get a better grasp of more of the material. Is there a way to inbox you a message? I tried a problem out using the method shown in this video but my teacher worked out the problem in another way but got close to the same answer but it was off by the 100th and 1000th decimal places. If you don't mind, do you think I can ask you the question?
Coolest voice I've ever heard!
Thanks!
Andrew Adelson ikr, better than my professor
I love that you sound like the stand up comedian Anthony Jeselnik hahah makes me understand this better haha
can u plz explain why standred deviation = sigma / root n ?
+aya eltokhy I derive the mean and variance of the sampling distribution of the sample mean in this video: th-cam.com/video/7mYDHbrLEQo/w-d-xo.html
There I show that Var(X bar) = sigma^2 / n, and so SD(X bar) = sqrt(Var(X bar)) = sigma/sqrt(n).
wait, how did u get 0.159 for the first Q at about 4:00 min in
Why would you like to standardize your variable at 3:30? Can you use non-standard normal distribution?
If we have access to software, we could simply ask it for the area to the right of 760 under a normal curve with a mean of 740 and a standard deviation of 20/sqrt(9). That area would be the same as the area to the right of 3 under the standard normal curve. But if we don't have access to software, and need to use a standard normal table, we'd have to use the method described in this video.
In addition, we often like to have a standard form from which to work, as it can simplify the discussion. For example, when testing the null hypothesis that the population mean is equal to a hypothesized value, the test statistic is of similar form to the z variable given in this video. Cheers.
jbstatistics Thank you very much. Really like your channel!!!
Bro you nailed it !!
You are a lifesaver. 😭😭😭
This is going to save my ass in the finals hahaha
the voice is hilarious
how do you do that? z=1 and change it to decimal??? thats where i am lost... HELP PLEASE
Same bro im lost here
9 years late but z-tables.
awesome video! Thank you!
Thank you :) i wish u were our college probability lecturer
Do you have the desire?
excellent explaination
Excellent video. I got question at 5:20, shouldn't we use t-table instead of z-table?
No. We are carrying out a probability calculation on the mean of a sample from a normally distributed population, where sigma and mu happen to be known. In this situation, X bar ~ N(mu, sigma^2/n) and (X bar - mu)/(sigma/sqrt(n))~N(0,1). Probabilities are found from the normal distribution.
bruh im not supposed to laugh while i'm craming for a test. nice vid
Thank you! maybe now I won't fail and cry
You're welcome!
The subtitles are hiding some of the content 💔
llloooool u made it more fun to understand it
thank you from Dubai.
THANK YOU THANK YOU THANK YOU
I like how it is narrated like sports
Thanks for helping
thank you very much.
Your voice is so COOL
Wow. Thank you.
Thank you
Excellent, Thanks a lot.........
Why does this guys intonation remind me of Mr. Mackey from South Park??
You say: "If the population is normally distributed, then x bar is also normally distributed". But Wikipedia says: "... when independent random variables are added, their properly normalized sum tends toward a normal distribution (informally a "bell curve") even if the original variables themselves are not normally distributed". Where is a mistake?
Both statements are correct. Your wikipedia statement is describing the central limit theorem, which I touch on briefly at the end of this video and describe in more detail in other videos.
Thanks for the answer
Is that Seth Rogens narrating?
I couldn't afford him.
anyway thank you very much it help me a lot
What is Zed?
The letter Z
Why do we need to assume the population is normal? CLT says *no matter the distribution* the sample dist of mean will always be normal ... no?
If the population from which we are sampling is normal, then the sampling distribution of the sample mean is normal. If the population we are sampling from is not normal, then if the sample size is large enough, the sampling distribution of the sample mean will be approximately normal. I discuss both of these notions in this video, and discuss the central limit theorem in greater detail in my video on that.
The sample size is important. If we're sampling from a strongly right-skewed distribution, for example, the sampling distribution of the sample mean of 2 observations will be strongly right skewed. As the sample size increases, that skewness will start to disappear and the distribution will start to look more and more normal.
Thanks for explaining what poutine is to me lol.
thanks
excellent !
Awesome....thanks! I get it now...the visuals were helpful!
+Jubal Music You're welcome. I'm glad to be of help!
hahahaha getting very excited in this video
It's hard not to get excited--it's good stuff I'm talking about here! That said, I have an updated and slightly more refined version of this video available at th-cam.com/video/q50GpTdFYyI/w-d-xo.html.
Haha, it's hard not to get excited about something you enjoy, Have my stats final in a few hours and tbh you're much clearer in explaining this stuff than my professor (he's a good guy though). Thanks for these videos!
LamboFan
You're very welcome. I hope your final went well!
the man's narrating is clean!!!! omega lol
Thank you legend!
You are very welcome!
Is this Cameron from Ferris Bueller?!
Poutine? :) Might you be Canadian?
I love his voice HAHAHAHA it's like watching a comedy movie HAHAHAHA
Btw tones of his voice in certain words are useful for memorization
Bro, you're the shit.
I love You.
Thanks!
thanks!
I dont get how you are calculating your Z scores with the tables. For .159 you would have to use -1 on the table. A Z score of (1) gives you a number of .8413
+Matthew Smith Your z table is giving the area to the left of the z value you look up. We want the area to the right, which is 1 minus that. I have videos on how to use the table, if you're looking for help there.
Funny that every slide looks like a Star Wars intro' reference
he sounds like stewie from family guy