Sampling Distributions: Introduction to the Concept

ฝัง
- เผยแพร่เมื่อ 28 ก.ย. 2024
- I discuss the concept of sampling distributions (an important concept that underlies much of statistical inference), and illustrate the sampling distribution of the sample mean in a simple example.


You are so helpful. You have no idea how much you change people’s lives
I absolutely loathed statistics in undergrad (bad experience with a lecturer) but now I've wanted to patch up on what I've tried to forget. These lectures are great; gets to the point without any unnecessary waffle :) Well done, sir!
Thanks for the compliment! I'm glad to be of help!
Same here bruv but economics
Can't appreciate it enough. Great job explaining!
Thanks!
A sampling distribution is a probability distribution. The sampling distribution of a statistic is simply the probability distribution of that statistic under the given conditions (sample size, etc.)
OMG THANK YOU SO MUCH IVE BEEN STRUGGLING WITH THIS CONCEPT I FINALLY GET IT WOWOW
I could have phrased that differently, but I think the statement given in the video is reasonable. If the observed value of the sample mean is within 22.1 units of mu, then mu is within 22.1 units of the observed value of the sample mean. We'd create the confidence interval for mu using X bar +/- 22.1.
You are most definitely correct in that our interpretation of a confidence interval relates to the true mean mu, and I go into that in detail when I discuss confidence intervals.
This is awesome! I'm still trying to understand why people don't learn through videos and individually designed teaching... i guess that's for the next century....
I'll see what I can do to help out this century.
Best introduction to the concept of Sampling Distribution😇
Thanks for the kind words! I'm glad to be of help!
I still don't get it :(
This is so gonna save my ass for my exam! Thank you!!
very clear explanation.. thanks for explaining the most fundamental concept for statistical inference
Great video. Please keep making. There is one big question remain. In real life situation to estimate the population, we don’t sample all the possible combination. We only take one subgroup of sample to estimate the population, so it that violates the Central limit theorem?
didn't realize this was almost 7 years old. thank you so much !
You are very welcome!
What does sampling distribution mean though? The definition in this video uses the same words (sample & distribution) to define it.
You are very welcome Neeraj!
00:02
Mari kita lihat pengantar konsep distribusi sampling.
00:07
Untuk sebagian besar, teknik inferensi statistik didasarkan pada konsep
00:11
distribusi sampling dari suatu statistik.
00:13
Nanti kita akan membahas inferensi statistik
00:16
dan jadi penting bagi kita untuk menurunkan gagasan tentang distribusi sampling ini.
00:22
Distribusi sampling dari suatu statistik adalah distribusi probabilitas dari statistik tersebut.
00:27
Dengan kata lain itu adalah distribusi statistik
00:31
jika kita berulang kali mengambil sampel dari populasi.
00:34
Jadi jika kita ingin mendapatkan sampel, dapatkan nilai statistik,
00:38
dan ambil sampel berbeda dengan ukuran sampel yang sama dan dapatkan nilai statistik itu,
00:42
statistik akan bervariasi dari sampel ke sampel sampel
00:44
sesuai dengan distribusi sampling statistik tersebut.
00:52
Mari kita lihat contoh sederhana untuk mengilustrasikannya.
00:54
Misalkan sebuah kelas universitas memiliki 16 siswa,
00:57
dan profesor ingin mengetahui usia rata-rata enam belas siswa di kelas tersebut.
01:01
Karena profesor tertarik pada 16 siswa tertentu ini,
01:06
16 siswa ini mewakili populasi yang diminati,
01:09
dan usia rata-rata mereka adalah parameter. Dan aku akan menyebutnya mu.
01:15
Mungkin profesor akan memiliki akses ke informasi ini dalam catatan mereka
01:18
tapi saya akan berasumsi di sini
01:20
bahwa mereka tidak memiliki akses ke informasi ini,
01:22
dan mu adalah kuantitas yang tidak diketahui profesor.
01:27
Saya juga akan berasumsi dalam contoh yang dibuat-buat ini bahwa profesor
01:30
dapat mengambil sampel tiga siswa dan mengetahui usia mereka.
01:34
Jadi mungkin seperti profesor punya teman
01:37
di Kantor Panitera yang akan mencari usia 3 siswa untuk mereka.
01:40
Atau sesuatu seperti itu.
01:43
Tanpa sepengetahuan profesor, inilah kenyataan situasinya.
01:47
Ini adalah usia sebenarnya dari 16 siswa di kelas.
01:51
Dan inilah kenyataan dari situasinya. Kita dapat menghitung rata-rata populasi sebenarnya mu.
01:57
Jika kita mengambil rata-rata dari 16 nilai tersebut,
02:00
kita akan melihat bahwa itu adalah 239.8125.
02:07
Tapi itu adalah nilai yang tidak diketahui profesor.
02:12
Bagi profesor, realitas situasi terlihat seperti ini.
02:16
Ada 16 siswa dengan usia yang tidak diketahui.
02:18
Saya akan memberi nomor pada mereka sehingga kami dapat melacaknya.
02:22
Profesor diperbolehkan untuk mengambil sampel acak dari tiga siswa dan mengetahui usia mereka.
02:27
Jadi mari kita pilih tiga siswa secara acak.
02:30
Titik merah mewakili siswa kami yang dipilih secara acak,
02:33
dan kami dapat mengetahui usia mereka dalam bulan.
02:35
Kami mendapatkan usia 233, 227, dan 238.
02:41
Dan kami dapat menghitung rata-rata sampel dari ketiga nilai tersebut hanya dengan
02:46
menjumlahkan nilai-nilai itu dan membaginya dengan 3.
02:50
Dan kami mendapatkan nilai dari rata-rata sampel 232,67,
02:56
bila dibulatkan ke dua tempat desimal.
03:00
Kita akan menggunakan nilai mean sampel
03:02 ini
untuk memperkirakan mu, yang merupakan kuantitas yang tidak diketahui oleh profesor.
03:09
Selain nilai tunggal ini,
03:11
perkiraan titik ini, yang memperkirakan mu.
03:15
Kami ingin memberikan beberapa ukuran ketidakpastian yang terkait dengan nilai tersebut.
03:21
Seberapa dekat kemungkinan nilai itu dengan nilai mu yang sebenarnya?
03:28
Untuk menjawab pertanyaan tersebut
03:30
kita menggunakan argumen matematis berdasarkan distribusi sampling X bar.
03:37
Terkait dengan itu adalah gagasan bahwa jika kita menggambar sampel lain
03:41
kita akan sangat sangat tidak mungkin untuk mendapatkan sampel ini lagi.
03:45 Rata
-rata sampel akan bervariasi dari sampel ke sampel.
03:49
Mari kita lihat sebuah contoh untuk mengilustrasikannya.
03:53
Ini enam belas siswa kita lagi, dan mari kita ambil ukuran sampel acak 3.
03:58
Kita mendapatkan tiga siswa ini dan mereka memiliki usia 251, 238 dan 276.
04:04
Dan kita dapat menghitung lagi rata-rata sampel dari mereka nilai
04:08
hanya dengan menjumlahkannya dan membaginya dengan 3.
04:12
Dan kali ini kita mendapatkan rata-rata sampel 255.
04:19
Dan jika kita mendapatkan sampel ini, kita akan menggunakan nilai ini untuk memperkirakan mu yang tidak diketahui.
04:26
Perhatikan bahwa mean sampel yang kami dapatkan di sini berbeda dengan
04:29
sampel mean yang kami dapatkan di sampel pertama kami.
04:33
Dalam pengambilan sampel berulang, nilai rata-rata sampel akan bervariasi dari sampel ke sampel.
04:39
Nilai statistik bervariasi dari sampel ke sampel.
04:45
Jika kami mengambil sampel berkali-kali, kami melakukannya dua kali di sini,
04:49
tetapi saya telah mempercepat prosesnya menggunakan komputer dan melakukannya jutaan kali.
04:52
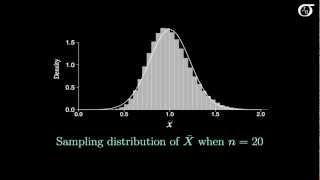
Kami memplot mean sampel tersebut dalam histogram,
04:55
akan terlihat seperti ini.
04:59
dan karena saya telah berulang kali mengambil sampel berkali-kali,
05:02
histogram mean sampel ini akan sangat mirip dengan
05:07
distribusi sampel sebenarnya dari mean sampel dalam skenario ini.
05:12
Untuk sedikit perspektif saya akan memasukkan
05:15
populasi berarti mu dengan garis merah.
05:18
Itulah yang diwakili oleh garis merah ini,
05:19
nilai mu kita, yaitu sekitar 240.
05:25
Kita dapat mencatat bahwa mean sampel akan didistribusikan
05:28
tentang mean populasi dalam beberapa cara.
05:32
Seperti yang akan kita pelajari nanti, seringkali mean sampel memiliki distribusi yang mendekati normal.
05:39
Tidak terlihat seperti itu di sini, tetapi dalam banyak situasi
05:42
mean sampel memang memiliki distribusi yang mendekati normal.
05:46
Di sini kami mengambil sampel 3 orang dari 16
05:50
dan dengan demikian ada 16 pilihan 3 atau 560 sampel yang mungkin.
05:55
Jadi perspektif lain tentang distribusi sampling di sini,
05:59
adalah bahwa dalam skenario ini, distribusi sampling mean sampel
06:03
adalah distribusi mean sampel di semua sampel yang mungkin
06:08
ukuran 3 dari ini populasi.
06:11
Kembali ke histogram mean sampel,
06:14
kita tidak perlu berulang kali mengambil sampel dari populasi.
06:17
Kami memiliki 560 kemungkinan sampel sehingga kami dapat
menghitung 06:22
distribusi sampel yang tepat dari rata-rata sampel dalam skenario ini.
06:26
Tapi saya ingin mengilustrasikan argumen pengambilan sampel yang berulang.
06:29
Dan karena kami berulang kali mengambil sampel berkali-kali,
06:32
histogram ini akan sangat mirip dengan
06:37
distribusi sampling sebenarnya dari X bar dalam skenario ini.
06:44
Perhatikan bahwa dalam praktiknya kami tidak berulang kali mengambil sampel dari populasi,
06:48
dan kami biasanya hanya mengambil satu sampel.
06:50
Tapi konsep distribusi sampling adalah konsep yang penting.
06:56
Nilai statistik yang kita lihat dalam sampel
06:59
akan menjadi sampel acak dari distribusi sampling statistik tersebut.
07:06
Mengapa kita bahkan membicarakan konsep yang sedikit abstrak ini?
07:10
Kita akan menggunakan argumen matematis berdasarkan distribusi sampling statistik
07:15
untuk membuat pernyataan tentang parameter populasi.
07:19
Jadi ini akan memainkan peran penting dalam inferensi statistik.
07:24
Ketika semua dikatakan dan dilakukan
07:26
kita akhirnya akan membuat pernyataan seperti kita yakin 95%
07:30
mean sampel terletak dalam 22,1 unit mu.
07:35
Dan kita akan diizinkan untuk mengatakan hal-hal seperti
07:37
95% dan 22.1
07:41
berdasarkan argumen matematis yang terkait dengan distribusi sampel rata-rata sampel.
i didnt understand. must rewatch. good videos man. EDIT: on 2nd watch ive understood much more thanks
When you did your million or so samples of 3 at the 5-minute mark, there aren't anything like a million different samples of 3 on a group of 16, are there? (Isn't 16 choose 3 the figure we need, which is 560?) Does that matter?
I address that in the video, and discuss how there are only (16 choose 3) = 560 possible samples. I drew a sample of one of these. Then I did that again. Then I did that again. And I did that 999997 more times. It matters in the sense that we can actually work out the exact sampling distribution of the sample mean here, by looking at the 560 possible samples. The drawing of a million samples will lead to a (very close) approximation to this. The basic big-picture notion of repeated sampling was what I was getting at here, and not the specifics of what happens when we're drawing from a finite population.
@@jbstatistics OK thanks.
The number of times the word sample/sampling has been used is this video tends to infinity.
It might have appeared to be tending to infinity for a little while, but it definitely stopped at a finite number.
jbstatistics What language are you two talking in?
Clorox Bleach Meadow Scent Math
very informative and simplified. Thanks. can you make a video of how to calculate the Correlation coefficient? and explain Pearson's coefficient ? thanks
very intuitive! great job JB. It is there (maybe I haven´t seen) a video where you discuss the sample distribution of the variance
+Juan Salazar Thanks Juan! My video on the sampling distribution of the sample variance:
The Sampling Distribution of the Sample Variance (12:00) (th-cam.com/video/V4Rm4UQHij0/w-d-xo.html)
In the 7:35 min, is it really correct that we're talking about sample mean to lie within 22.1 of mu?
I thought that we should talk about the "Population mean MU" to lie within a certain interval of the sample mean "X BAR" with 95% confidence ~ Not the other way around. i.e. we use the sample mean to predict where the actual true mean (population mean) is falling around it to a certain degree of confidence. Could you plz clarify this point?
Many thanks for all your efforts...
I love the animations
Thanks!
Thank you for your help!!
5:07, what is a TRUE sampling distribution of the sample mean? that of all possible samples of size 3?
That was a really good analogy. It helped a lot. Thanks
+Ferdin Donbosco You are very welcome!
Understood.........but how is it different from a regular distribution?
D-4 hours before exam. Thx for saving me
very many thanks !
very much informative
Why is there 560 possible samples?
Is distribution the same thing as variance?
Alex Delarge out of 16 you are selcting any random 3 ppl everytime so 16C3
This is really good but, according to you the ages of 16 students here are different and that is why we are getting different values every time we take 3 Random samples. What if the ages were less scattered and most of them would have been identical?
+Sushmoy Mallik Well, if we take it to the extreme and say that everybody is the same age, then the sample mean will of course take on the same value every time. But we're not typically dealing with populations in which the variable of interest has the same value for everybody. The value of a statistic will vary from sample to sample in some way, but it is often possible for different samples to lead to the same value of the statistic.
How did you get the 560 possible outcomes? Thanks!
That's the number of ways we can pick 3 items from 16 if order of selection is not meaningful. It's calculated with the combinations formula AKA binomial coefficient: 16 choose 3 = 16!/(3!(16-3)!) = 560.
i love u jb!
What are the differences between a distribution and a sampling distribution?
Distribution means we do statistic on all the data on the population... a sample distribution we draw a few data of the same size from a population and we carry on our statistic on it......plot it and see how the tendency goes......
How to calculate 560 when you sample 3 people from 16 total? I hope it's on basis of some permutation/combination formula, plz share the formula. Thanks
It's the combination formula. How many ways are there are choosing x items from n, if order or selection is not important? nCx = n!/x!(n-x)!. Here, that's 16C3 = 16!/3!13! = 560.
@@jbstatistics Thanks a lot! Regards
clear explanation, thanks
Someone please answer my question. If the x axis represents the sample mean then what does the height of the histogram represent??
Probability of that mean.
how you get the 3 random sample values?
by choosing from the given variables I guess. Not sure as well
Please... put some ads. It won't hurt anyone. Those who don't want to watch the ads will just skip them. You are helping us for free, we also can be of help. Let us help each other :)
what is X bar ?
X bar is the sample mean. In the situation in the video, it is the mean age (in months) of the 3 randomly selected students.
Thanks...
Why are we learning this? Whats the meaning of life?
The first question I can answer. The second, not so much.
Maths made so easy!!!!
I'm glad you found it easy to understand!
I think the example is not apt. For 16 students (or even for 1000 you can exhaustively calculate the average). You should pick better examples resembling the reality of events. Thanks for the easy explanation of concept though.
I chose a toy example like this purely intentionally. Otherwise it's too abstract and a 20 second video: "Suppose we randomly sample 3 adult male Canadians and measure their heights. If we took another sample of 3 adult male Canadians and measured their heights, we'd get a different average. So, the average would vary from sample to sample, and we call the distribution of that average the sampling distribution of the sample mean."
Sure, I discuss it in that fashion sometimes, but the purpose of this video was to show a more concrete example and see where the numbers are coming from. To do that, we'd need to look at a simple, specific case. That's what I went with here. I use practical real-world scenarios in my videos almost always, but I chose a simple toy example here purely intentionally for pedagogical reasons.
I'm the only one that every subject in Statistics sounds the same too me?
sampling of sample and distribution of sampling means and means of distribution and sampling distribution it all sounds so blaaah!!! they couldn't come up with better terms for these things.. as if they TRYING to make it difficult, probably envious of some other Mathematicians, Physicists...
Those are some old students hahaha.
As stated in the video, their ages are given in months. They're of pretty standard age for university students.
Yeah, because the average student age is 232... Is it so hard to use a realistic example?
It's age in months, as stated in the table. I think you'd be hard pressed to find an unrealistic example in any of my videos.
You need to learn to look properly..
Is it so hard to read properly?
Could not thank you enough.
Your videos are so extremely clear, you are slowly saving me from feeling like im drowning in stats
amazing explanation thank you for helping me through my online COVID-19 classes
Sampling is with replacement and combination? Thank you,
So much.
I feel permutation of each sample does not make sense.
&
Without replacement does not make sense because not enough sample of three ages of different students be available for the sampling.
If you have a patreon, I will give you money :D. This is of excellent quality.
9 years later but it's still the most easily understandable video
Thanks a lot, very understandable
You are very welcome.
Your platform is better to understand than Khan Academy...or we can say like Khan academy could be a supplement intake after watching ur content
Thanks! I appreciate it and wholeheartedly agree that my stuff is better :)
this was so helpful. i'm a visual learner so this was very good! thank you so much.
You are very welcome!
Maths & Statistics hates me ....... :(
I think it's more likely that Math & Stats loves you!
I am so grateful for this video. My Professor talked about this concept several weeks ago. But I have been confused with this concept for a really long time, trying to figure this out by myself. You have explained this concept in a crystal clear way. And this video has definitely helped me a lot! Thank you so much!
Thank u soo much, now i got the concept, awesome work 👍
thanks a lot! it was awesomely clear
Beautiful.!
So is it safe to say that the random variable of a sampling distribution is the statistical value of all combinations of samples we can obtain from the greater population? If that was stated correctly ha
Your wording is a little problematic :) But you're likely thinking (roughly) along the right lines.
jbstatistics thanks! Your videos are great. I'm studying for probability exam for actuaries and it's really helping.
Where did you get that m=239.8125? 😅
That's the average of the 16 values in the population.
Since there are 560 possible combinations, why do we sample it a million times? Since, I guess a multiple of 560 should give the same results as a single 560 samples set , please enlighten me.
Here at a time, you are taking 3 items out of 16. If you took, 8 items at a time , no of samples 16C8 would have been 12870. That reduces the error. When we go beyond that , the error even reduces. So, if we have to take a deterministic approach at getting pretty low error for a variable n, sampling size should be n/2 or (n-1)/2. What do you say?
We would be best off simply getting the ages for the 16 students and calculating the population mean, if it were possible for us to do. In the example, I state that the administration is only willing to give the ages of 3 randomly selected students, so getting a larger sample is not possible. I wanted an example where the population size was small (so that we could see all of the values), but it was not possible to get measurements on all of the individuals. This is (as I state in the video) a bit of a contrived example, but there aren't all that many simple and common situations that where the population size is small and we draw only a very small sample from it.
I also state in the video that we could come up with the exact sampling distribution of the sample mean by coming up with all 560 possible samples (where each one has a 1/560 chance of occurring), and calculating the sample mean in each case. I wanted to illustrate the notion of repeated sampling by repeatedly sampling samples of size 3, not by figuring out all possible samples. In each of the 1 million samples, each of the 560 possible samples of size 3 had a 1/560 chance of being picked. After 1 million draws, the empirical distribution will very closely resemble the exact sampling distribution.
Since the histogram represents a million samples, wouldn't you expect it to more closely approximate a normal distribution (according to the CLT)? Or, put another way, after a million tries, this distribution, as you say, should closely resemble the exact sampling distribution. Wouldn't you expect that to be more symmetrical?
Thank you. Getting a little clearer.
I'm glad to be of help!
I appreciate the effort but the explanation isnt clear still, as I didnt understand!!
Many students have a lot of trouble understanding sampling distributions. This is well known in statistics education circles. I don't think I'm capable of making it any simpler or clearer than I did in this video, and I'm not sure anybody else is either. There's a certain level of abstraction in this topic that a large proportion of students struggle with. You're just going to have to spend a little more time thinking about it.
@@jbstatistics Thanks ,Sorry if I had offended ..
@@subramaniankaushik I'm not offended. I'm simply stating that some topics aren't the easiest to understand, and the fact that you don't understand a concept after watching short video on it does not imply that the video was unclear. All the best.
Great job
Thanks!