Thanks a lot for your video. It is much clearer than the other videos on the SIR model I watched since it uses numbers. I now will explore the plotting of the curves in Matlab.
man that was great, are you going to go into more depth about determining the severity? What kind of methods should one use to determine s(t) when I(t)=0?
For the SIR model, everyone who gets infected ends up moving to the removed class R (and can't get back to the susceptible class). So the cumulative number of infections is just I(t)+R(t), the number of people currently infected plus the number that have been removed. Since we don't actually track R(t), you have to calculate it as R(t) = S(0)+I(0)-S(t)-I(t), i.e., the amount that S+I has decreased since the beginning.
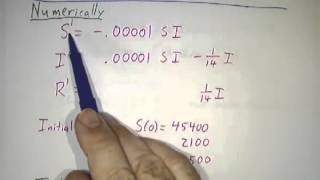
Unfortunately, there's no simple way to graph S(t) and I(t). In this video, I just tried to show how one could get an idea that S(t) should decrease (possibly to zero, but we couldn't tell) and that I(t) should first increase then decrease to zero. To get a better estimate of what the graphs of S(t) and I(t), we can use computer programs to estimate their values. If you click the link to the Math Insight page in the description of this video, you can see some Javascript applets that solve the equations for you and plot the graphs. Right now, however, they run very slowly and may cause your web browser to be unresponsive for awhile. (I should think of using a different software package that runs more quickly.) With such a computer program, you can get a more accurate picture of the graphs and also see how they change when you change the parameters of the equation.


Thanks a lot for your video. It is much clearer than the other videos on the SIR model I watched since it uses numbers. I now will explore the plotting of the curves in Matlab.
Very cool, very helpful, thorough video with real numbers and straightforward explanations. Officially subscribing.
Where did you get the parameter values
Also, why does the infected curve reach a peak and then decrease?
How does one gine values to a and M?
man that was great, are you going to go into more depth about determining the severity? What kind of methods should one use to determine s(t) when I(t)=0?
You can divide one equation by the other and solve for x(t) with initial conditions.
Sorry, I meant for S(t) in this case.
Could you find the total cumulative infection numbers by integrating one of the curves?
For the SIR model, everyone who gets infected ends up moving to the removed class R (and can't get back to the susceptible class). So the cumulative number of infections is just I(t)+R(t), the number of people currently infected plus the number that have been removed. Since we don't actually track R(t), you have to calculate it as R(t) = S(0)+I(0)-S(t)-I(t), i.e., the amount that S+I has decreased since the beginning.
Great video! Thank you!
Great vid! Thanks. How did you graph your function? After you find your S(0) and I(0) - how do you continue to graph it?
Unfortunately, there's no simple way to graph S(t) and I(t). In this video, I just tried to show how one could get an idea that S(t) should decrease (possibly to zero, but we couldn't tell) and that I(t) should first increase then decrease to zero. To get a better estimate of what the graphs of S(t) and I(t), we can use computer programs to estimate their values. If you click the link to the Math Insight page in the description of this video, you can see some Javascript applets that solve the equations for you and plot the graphs. Right now, however, they run very slowly and may cause your web browser to be unresponsive for awhile. (I should think of using a different software package that runs more quickly.) With such a computer program, you can get a more accurate picture of the graphs and also see how they change when you change the parameters of the equation.
you are amazing!! Thank you so much !
Wonderful talk. I am very happy
excelente por la explicación
Thank you!
Great!