
- 37
- 118 564
Ruth M Hummel
เข้าร่วมเมื่อ 17 ต.ค. 2016
I am the Senior Manager of JMP Education and Training. JMP is statistical software for dynamic data visualization and analysis. My team creates and curates learning materials, including mini-lessons, tips-and-tricks, and full multi-part e-courses, which we make available at community.jmp.com.
I began using JMP in 2010 as a lecturer teaching graduate statistics courses at the University of Florida. I loved the ease-of-use of JMP, and how I could engage students very quickly in data exploration and analysis. JMP allows scientists and engineers to get quickly to the power of data visualization and analytics.
I hope you find these videos helpful to developing your own understanding of modern statistical methods, your access to visualizations and demos to help teach statistical concepts, and your love of JMP Statistical Software!
Generalized Linear Mixed Models: Part 4 (of 5)
In this JMP Academic Webinar, we cover Generalized Linear Mixed Models in five parts. This is the fourth part of the series, covering a count example with a Poisson distribution.
GLMM Part 1: Intro, Experiment, and lots about Mixed Models (24:09)
Welcome, and reminder of LM, GLM, MM, and GLMM: 0:00
Agenda: 2:32
Review of random effects and mixed models: 3:37
Key difference between a fixed effect and a random effect 7:06
Summary of Experiment: 9:22
Showing the personalities in Fit Model 12:12
Using SLS and Mixed personalities and seeing the same model but some different output options14:02
Exploring the interaction and the overlay plot for the mixed model 17:54
Understanding LSMeans 19:19
GLMM Part 2: More about GLMMs (7:04)
Count data (a Poisson distribution) 0:00
Details about and examples of GLMMs 2:35
Model + Distribution + Link 4:40
Details about REPL estimation
GLMM Part 3: Download and install the Add-In and find more examples! (4:18)
Webpage to download add-in and find more examples 0:00
Downloading and installing the add-in 1:54
Credit to the Add-In author, Meichen Dong 3:32
GLMM Part 4: Count example with Poisson distribution and LOTS of Graphing tips (27:40)
Setting up the Poisson Mixed Model 0:00
Back-transforming Estimates and CIs 2:52
Graph Builder for the Interaction Plot (with lots of JMP tips!!) 10:05
Saving Figures and Output and Data 17:17
Overdispersion 18:20
Back-transforming pairwise comparisons 25:38
Where to find more examples and ask questions 27:08
GLMM Part 5: Proportion example with Binomial Distribution (9:17)
Introducing the Binomial Scenario 0:00
Fitting the binomial GLMM 1:39
Back-transforming Estimates and CIs 4:00
Interaction Plot 6:46
Where to find more examples and ask questions 8:39
มุมมอง: 2 843
วีดีโอ


Generalized Linear Mixed Models: Part 5 (of 5)
มุมมอง 1.7K3 ปีที่แล้ว
In this JMP Academic Webinar, we cover Generalized Linear Mixed Models in five parts. This is the fifth part of the series, covering a proportion example with a binomial distribution. GLMM Part 1: Intro, Experiment, and lots about Mixed Models (24:09) Welcome, and reminder of LM, GLM, MM, and GLMM: 0:00 Agenda: 2:32 Review of random effects and mixed models: 3:37 Key difference between a fixed ...

Generalized Linear Mixed Models: Part 3 (of 5)
มุมมอง 3K3 ปีที่แล้ว
In this JMP Academic Webinar, we cover Generalized Linear Mixed Models in five parts. This is the third part of the series, covering where to find the JMP Add-In, how to install a JMP Add-In, and where to find more examples of using this JMP Add-In. GLMM Part 1: Intro, Experiment, and lots about Mixed Models (24:09) Welcome, and reminder of LM, GLM, MM, and GLMM: 0:00 Agenda: 2:32 Review of ran...

Generalized Linear Mixed Models: Part 1 (of 5)
มุมมอง 22K3 ปีที่แล้ว
In this JMP Academic Webinar, we cover Generalized Linear Mixed Models in five parts. This is the first part of the series, covering mixed models, interaction plots, and LSMeans. GLMM Part 1: Intro, Experiment, and lots about Mixed Models (24:09) Welcome, and reminder of LM, GLM, MM, and GLMM: 0:00 Agenda: 2:32 Review of random effects and mixed models: 3:37 Key difference between a fixed effec...

Generalized Linear Mixed Models: Part 2 (of 5)
มุมมอง 5K3 ปีที่แล้ว
In this JMP Academic Webinar, we cover Generalized Linear Mixed Models in five parts. This is the second part of the series, covering the basic statistical details of GLMMs. GLMM Part 1: Intro, Experiment, and lots about Mixed Models (24:09) Welcome, and reminder of LM, GLM, MM, and GLMM: 0:00 Agenda: 2:32 Review of random effects and mixed models: 3:37 Key difference between a fixed effect and...

JMP Academic Series: Teaching Biostatistics Basics
มุมมอง 2.2K3 ปีที่แล้ว
In this webinar we cover tools commonly used within the health sciences, including interactive graphics, descriptive statistics, confidence intervals and hypothesis tests, odds ratios, relative risk, linear and logistic regression, and a very brief introduction to survival analysis and fitting mixed models (in JMP and JMP Pro). You can navigate directly to a topic using these time stamps: Conte...

Panel: Best Practices for Preparing Students for a Career in Business Analytics/Data Science
มุมมอง 5803 ปีที่แล้ว
As the fields of Business Analytics and Data Science for Business continue to evolve, there is much uncertainty about what business programs should teach. The panel of academic faculty and analysts in industry answer the questions: 1. What skills and tool sets business analytics professionals are critical in this environment? 2. How can academia can prepare students to be able to perform in thi...
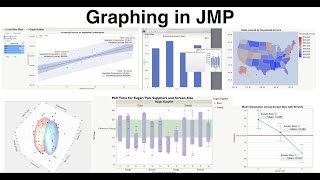
JMP Academic Series: Creating and Customizing Graphs
มุมมอง 22K3 ปีที่แล้ว
We cover a bunch of graphs and ways to customize graphs in JMP. 4:51 General use of Graph Builder 15:16 Regression Example 23:13 Bar chart with Hover Graphlet 29:20 Customize in Distribution 30:57 Moving Average Formula Column 33:57 Maps 37:51 Boxplots in Nested Groups 44:55 Plotting Results (LSMeans) 48:08 Lat/Long Formats 49:19 Get Help at community.jmp.com 51:52 Mosaic Plot, Parallel Plot 53...

Special Edition: Analyzing Data from the Biological Sciences Using JMP
มุมมอง 1.8K3 ปีที่แล้ว
This recording was presented at the American Society for Horticultural Science conference in August 2020. Topics covered include: - Mixed models (random effects) - Split-plot designs - Count data (and other non-normal responses) - Overdispersion (variance changing with the mean) - Creating better figures - Dealing with many responses collected on the same plants - Quadratic effects - Designing ...
JMP Academic Series: Teaching ANOVA and Regression
มุมมอง 4.2K4 ปีที่แล้ว
1:00 Overview of Resources 12:16 T-test 23:34 ANOVA 31:12 Interpret Compare Means 32:13 Multiple Comparisons Adjustments in ANOVA 34:30 Filter the results to only certain groups 34:59 Simple Regression (and Regression Through the Origin) 44:51 Polynomial Regression: Quadratic Fit 45:40 Log-Log and other special fits 46:03 Spline Fit and Cubic Fit 46:48 Regression in Graph Builder 48:00 Fit Mode...
JMP Academic Series: Resources for Teaching Intro Stats online, in-person, or hybrid
มุมมอง 4334 ปีที่แล้ว
Are you preparing to update or prepare a new basic statistics or data analysis course? Looking for new examples, assignments, or instructional videos? Looking for interactive concept demos, case studies, eLearning courses with certificates of completion, or other instructional or supplementary materials? In this webinar, we identify resources that you can use in your statistics and data analysi...
JMP Academic Series: Research Methods (Clustering, PCA, EFA, CFA, Path Analysis, SEM)
มุมมอง 21K4 ปีที่แล้ว
In this webinar we explore techniques needed for Research Methods, including high-dimensional data visualization and modeling using JMP's graphing and multivariate analysis platforms (e.g. Multivariate, Cluster, PCA, Factor Analysis, and SEM). Go to www.jmp.com/en_us/academic/academic-webinars.html#sem to download the slides and data.
JMP Academic Series: Extending JMP with R and Python
มุมมอง 5K4 ปีที่แล้ว
In this webinar we explore the many ways to extend core JMP functionality through its integration with R and Python. • Who should watch? JMP users who need an analysis available only in R or Python, or users of R and Python who also want to make use of time-saving, interactive, and powerful features in JMP. Also JMP users who want to package a JMP GUI front-end for an R or Python routine, to al...
JMP Academic Series: Modern DOE (7 April 2020)
มุมมอง 1.8K4 ปีที่แล้ว
In this JMP Academic Series webinar, we are joined by Dr. Bradley Jones and Dr. Douglas Montgomery to learn about their new book "Design Of Experiments: A Modern Approach." They describe the need for a modern approach to teaching and using DOE. In the process, they point out the connections between optimal modern designs, orthogonality in designs, and well-known traditional designs. Dr. Jones i...
Running and Interpreting a Basic Expression Analysis
มุมมอง 4.5K4 ปีที่แล้ว
This video shows how to set up, run, and interpret a basic expression analysis in JMP Genomics. In this example I use the Basic RNAseq Workflow, which is a pipeline of some simple exploration on the markers and samples (looking at expression distributions for samples, removing "bad" samples, normalizing the samples' expression, exploring correlations and principle variance components) directly ...
JMP Student Edition: Data Exploration and Analysis
มุมมอง 1865 ปีที่แล้ว
JMP Student Edition: Data Exploration and Analysis
JMP Academic Webinar Series: Statistical Quality Control
มุมมอง 1.7K5 ปีที่แล้ว
JMP Academic Webinar Series: Statistical Quality Control
Using the JMP Statistical Concept Applets
มุมมอง 1K5 ปีที่แล้ว
Using the JMP Statistical Concept Applets
JMP Student Edition: Data Exploration and Analysis
มุมมอง 5015 ปีที่แล้ว
JMP Student Edition: Data Exploration and Analysis
JMP Academic Series: An Overview of JMP Genomics
มุมมอง 1.9K6 ปีที่แล้ว
JMP Academic Series: An Overview of JMP Genomics
JMP Academic Series: JMP for Biostatistics and the Health and Life Sciences
มุมมอง 8086 ปีที่แล้ว
JMP Academic Series: JMP for Biostatistics and the Health and Life Sciences
Getting Started in JMP Genomics: Creating the EDF and Importing SAM and BAM Files
มุมมอง 6096 ปีที่แล้ว
Getting Started in JMP Genomics: Creating the EDF and Importing SAM and BAM Files
Getting Started in JMP Genomics - Overview of Studies, Import, and Workflows
มุมมอง 1.1K6 ปีที่แล้ว
Getting Started in JMP Genomics - Overview of Studies, Import, and Workflows
Connecting JMP to SAS OnDemand for Academics -- on a Mac
มุมมอง 6156 ปีที่แล้ว
Connecting JMP to SAS OnDemand for Academics on a Mac
JMP Academic Series: Teaching Statistics in the Health and Life Sciences
มุมมอง 4526 ปีที่แล้ว
JMP Academic Series: Teaching Statistics in the Health and Life Sciences
JMP Academic Series: Data Summary and Analysis with JMP (13 Nov 2017)
มุมมอง 6996 ปีที่แล้ว
JMP Academic Series: Data Summary and Analysis with JMP (13 Nov 2017)
Does jmp run partial least square pls?
Can you please do a video in how to use DOE with an example from start to finish?
Also, how do we import R dataframes into JMP? I see that the T-SNE app imports data processed with R directly into JMP for visualization. How is that? I presume that the machine learning algorithm spits out multidimensional data that isn't easily exported as a csv...
Nice. For the St. Louis housing app, how did they develop the Amazon web app. I understand that the neural net model is running in the background, but the interactive GUI itself. Also, does the neural net model also predict based on location?
How have I been in research science for 20 years and just now learning about JMP? I learned about it from Avery Smith (who teaches about corporate data analytics). My advisors were either out of the loop or just wanted me to suffer trying to figure out how to create sophisticated charts with Prism and SPSS! 😭😭
Very a long time from last video. Wish you continue upload new videos. I miss you so much
Pls continue to post videos. This is very helpful for jmp users
Thank you so much for your video lessons, Ruth. You're an amazing teacher.
Thank so much! words failure me to express how your lecture hel
Great video! Follow another one helping to undesrtando about how to use Graph Builder in JMP: th-cam.com/video/03dtaF8FtHY/w-d-xo.html
Very informative
Hi Ruth! This is a great video. I have 1 question: I import data from excel files and use Graph Builder to make Dashboard. Then, how can I have same 1 format Graph if I change data in raw exel file?
Thanks for your sharing, very useful to me
Excellent explanations, thank you
I have to say it’s really a good video! Thank you very much!
Great 👍. I have data but I am not sble to organise data in right form or tabulating the data !! Does any one help me to organise those data? It focuses on vegetation distribution on different altitudes…
Thank you. I was struggling with others like Cognos, Tableau, but JMP is so intuitive and easy to use.
I have a question about the interpretation of linear regression results Thank you
Thank you for the great tutorial! Is there any way to change the default font size/color/type for future use in Graph Builder?
That's helpful, thanks
Thanks for the tutorials, they are great!
Great video. Thank you very much. Is your software available for free. How can get it please?Thanks
Thank you! This is super helpful, really like how it’s explained.
Simply superb video. Thank you thank you and thanknyou.
Could you please mention the analysis of beta diversity, PCOA, hierarchical cluster analysis or NMDS. And it's importance
So helpful. Thank you!
Thank you so much Ruth for this lesson! Very helpful!
Hi Ruth, thanks for the great video, it is very helpful to find more applications on JMP. I'm trying to combine matplotlib and JMP graph builder, but I don't know if it is possible. I want to plot a particular graph that I only could plot on matplotlib; but I want to take the advantages about the JMP graph builder interface, like data filtering. It is possible to show a matplotlib plot over the JMP graph builder interface? Thanks in advance
thank you so much for the in depth jmp pro. This is great content.
Could you please help us with the same analysis using STATA software?
Hi Muhammad, Ruth works for JMP and we would be happy to help you get JMP Pro and perform this analysis with that software if you are interested.
Legend!
Thanks!!
Very informative webinar, Thank you so much Hummel.
OMG this is great!
Which software your using
Hi, I think she used JMP which is a stats software under the SAS Institute.
JMP Pro
Madam, your serious of mixed model interpretations are superb. I am just asking you to perform these results in SPSS. If you can do it, would be really appreciated
If you enjoy superb videos like this you should consider using JMP Pro.
Great presentation Ruth. a quick question, would you have an idea how to use the multivariate mixed effects model in R?
your wonderful!
Why I don’t have mixed effect model in jmp free trial?
Great video. Thank you.
You are amazing. Thank you so, So much for this content.
this is really helpful. starting to learn how to use jmp genomics just now and this is a good starting point for me.
Hi Ruth, Thanks for showing us how to work with graph builder. Is there any way to change graph width and height?
Hi Bahareh, yes! An easy way is to click in the bottom right corner of the graph and drag it to the dimensions you want. Here's the section of the JMP Help that gives tips on changing the appearance of a graph: www.jmp.com/support/help/en/16.0/#page/jmp/change-the-appearance-of-graphs.shtml#
Thanks Ruth! Could you also give an introduction to nonparametric tests? Thanks a lot!
Thanks for the suggestion! I'll put that on my list!
Thank you, it was really awesome!
Thank you uploading
Is it important to show 95% confidence ellipse in PCA? why it is so? If my data is not drawing it then what should i do ? can i used PCA score graph without 95% confidence ellipse?
Hi Qasim, sometimes people publish papers showing PCA plots without adding the 95% confidence ellipse -- it is an option to add that ellipse and you are the one to decide if it adds information that you want to communicate with your plot. When people include the ellipse, it is usually to help the viewer's eye better see trends. Often people will add grouped ellipses, so that you get a different ellipse for each group. Then a viewer can better see if the groups are highly overlapping or if they are very separated in the PCA dimensions.
Hello Ruth! This is a great video. I have a question, typically students tend to collected their data using a wide format. However, I do know that software such as SAS and probably JMP Pro, it is better to use a linearize the dataset (i.e., long format). Is there a way we can linearize the data in JMP Pro? Thank you so much! Go Gators!
Hi Tavin, I'm so glad you found it helpful, and Go Gators! ;) To take wide data and transpose it to tall, you will need the Tables > Stack function. Here is a video showing how to use this: th-cam.com/video/W5cJfE596Hg/w-d-xo.html. If you want to do more data table manipulation, this video might help: th-cam.com/video/mwr_ER46wlA/w-d-xo.html.
I really enjoyed it thank you a lot.
Great webinar. Very clear. Thank you!
Glad you enjoyed it!