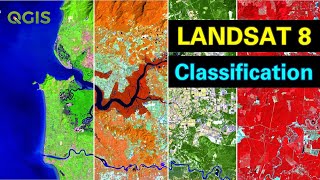
Supervised classification in QGIS || A complete Tutorial || 100%

ฝัง
- เผยแพร่เมื่อ 21 ก.ย. 2024
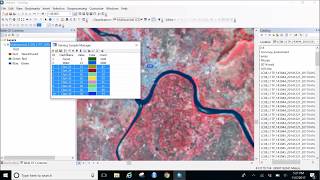
- Supervised classification is based on the idea that a user can select sample pixels in an image that are representative of specific classes and then direct the image processing software to use these training sites as references for the classification of all other pixels in the image.
In this tutorial, I demonstrate how to carry out supervised classification in QGIS.
Enjoy


![วันเกิดเธอ (TO YOU) - PHUWIN [ OFFICIAL MV ]](http://i.ytimg.com/vi/_ROx1Bj3T0Y/mqdefault.jpg)


If you'd like to support our journey and help us provide even better GIS and Remote Sensing insights, consider contributing through 'Buy Me a Coffee'. Your support ensures we can continue creating tutorials, sharing tricks, and making our content as informative and enjoyable as possible.
🙏 Contribute💰💰 Here: www.buymeacoffee.com/jessebuyungo
🙏 Contribute💰💰Here: www.buymeacoffee.com/jessebuyungo
Very clear from start to finish.
Thank you so Richard. Thank you for my coffee tooo
Thanks, Jesse! Love your tutorials bro...
don't know why I can not draw multiple poligons in train data, but thank you for the tutorial.
Hold 'Ctrl' button on your keyboard to add multiple polygons
This is very useful for me thank you so much.
You are welcome!
Good stuff Jesse!
Thank you so much Darren
please create a tutorial of preprocessing and supervised classification/indices of mangrove cover using planet data
Thank you for this
hi im facing the problem ie the following signature will be excluded if using ,max likelihood
In my project. At the Classification menu section has a 'select at least one signature' notification, and then so what should I do?
Could you share a screenshot of the error please?
I'm trying to do this with a multiband image but I can't find this option, what version of Qgis and the SCP plug-in were you using?
What's your QGIS version?
After collecting all of the training data, I was unable to run the classification. I got messages saying "error: process failed", "SCP: multiprocess: error classification", and "SCP: covariance matrix". Are you familiar with these errors?
Not so please, could you need a personal tutorial?
hello. i made the classified image. when i use the 'identify features' option and click on any pixel, then i get the pixel value as i assigned and i get the lat-lon of that point. but i cannot find any attribute table or anything that lists up all the lats and lons as an array. so basically i am trying to use the pixel values from this file and change another files values at the same lat-lon point. how can i get the lat-lon of all the points of my classified image?
identify features works on vector not raster data, so it will give you the features in your vector layer
sir i have question , for calculating NDWI or any indices it is required to convert DN to TOA radiance
Yes you should convert
Thanks Jesse for your awesome work. Please I wish to inquire how I can extract all rooftop images of buildings across a city and store them as individual images?
I have not gotten you very well, can you please rephrase your question please
@@jessebuyungo I want to extract the rooftop images (raster) of buildings in an area and save them as individual images for use. In other words, If I have 10 buildings in an area, I want to extract the rooftop images of the 10 buildings and save them as individual files.
@@airedav Hello, I think you can check if your area has OSM data of buildings from which you can download the building footprints. I think that can help.
I was following full process why showed classification errors? After declaring classifier
could you please share a screenshot of the error
Why I can't make more than one sample. When I draw another sample, the previous sample disappeared. Please answer me
Sorry chief. I've been away. Use shift key while drawing multiple ones
@@jessebuyungo Thank you for your answer. Should I use left or right shift key? and are you sure that should I use shift key or control key? Thanks in advance for your answer!
thanks a lot
Do one on how to create a map on average annual data of a place
Google earth engine can give us a good one on this
@@jessebuyungo * annual rainfall data
Where did you download the image?
Sentinel Copernicus hub