thanks for showing vegan % mutate(day = str_replace(Group, ".D*, "", .before =2) which will put the mutated column to a designated position, in the example above on position 2, just in front of the "old" column 2 so you dont need these select(1,2, everything() ) lines anymore
another thing I often use in the case of creating a "clean" OTU table is column_to_rowname(., var = "Group") this lets you stay in the tidyverse and piping :) thanks for the awesome videos
Very informative!! Thank you!! I usually attribute name to the object in the last dplyr function as " %>% as.data.frame(.) -> new_object" but I know it is little weird :)
Hi Pat! Thanks so much for the videos, I've just recently discovered your channel and it's been incredibly helpful for my learning process. I'm wondering if you could clarify the need to calculate distance matrix before running NMDS? I have a species assemblage dataset from an underwater visual census (UVC). My data has a ton of zeroes and just like yours, a lot of columns (species). I've ran both NMDS without calculating the vegdist (+ automatic transformations) and with vegdist. They look similar but not the same. Thus I'm not sure which one to use for my publication. Why would you advice me against using the plot without prior calculation of distance matrix? Also, seems like my data has a high stress (>0.2) when run with k=2. If I run it with k=3, should I be presenting the figure in 3D? Thanks in advance!
Thanks for watching! First - please do not publish a 3D image on a 2D page 🤓 you need to use a metric like bray Curtis that ignores double zeroes. The default may be Euclidean which is frowned upon in ecology since it counts double zeroes as being similar
@@Riffomonas yes, I've been using bray curtis distance, and I only asked about the 3d question because of one annoying coauthor that insists of plotting a 3d graph 😅 so, should i not be running the metamds before turning my data into a distance matrix? I've also seen some examplea that turn their abundance data into relative abundance using decostand. I'm still not entirely certain why/why not i couldn't be using the nmds ordination with raw data.
Hmmm, I'm not sure - why are you giving metaMDS shared instead of a distance matrix? Could that be the difference between what you and I are doing? github.com/riffomonas/distances/blob/main/code/nmds.R
You really need to put `+ coord_equal()` or +`coord_fixed()` on your ordination diagrams created by hand. The Euclidean distance on the plot is some approximation to some other distance (in NMDS the rank order of the euclidean distance on the plot is intended to be a close approximation of the original distances between samples) and if you don't keep a fixed aspect ratio this visual distance interpretation is broken
Great channel! I've been trying for months to learn some of these techniques from scattered sources and you're really helping me make sense of the mess of lessons I've tried to wrap my head around.
For an alternative to the usual rarefaction method, take a look at the SRS function in the SRS package. 1. Beule L, Karlovsky P. Improved normalization of species count data in ecology by scaling with ranked subsampling (SRS): application to microbial communities. PeerJ. 2020;8:e9593.
Thanks for watching and the paper recommendation. I used this on these data and found it behaved nearly identical to using relative abundance data which has its own set of problems namely that distances are affected by sampling effort. I’ll talk more about this in the next few episodes
Hi Samadhi - thanks for watching! It's hard for me to get the right speed of speaking and coding. Have you tried slowing down the play back speed and see if that helps any?
This is a great overview of using vegan for calculating distances and plotting them. Some nice additions (if you don't already have planned) would be to show how to pull out which variables (or species) are driving the spread on the plot and adding that data to the plot. You mentioned that the different clouds pertained to different days, so I'm assuming you're going to discuss that in another video.
Just a note: we handle data frames of abundance data just fine in vegan's community ecology functions, including `vegdist()`. The only restriction is that you have to get rid of meta data (the `Group` column in Pat's data) from the data frame just like Pat showed in the video. You just don't need to do the last step of converting to a matrix.
Hi Pat! This was super helpful. I've performed rarefaction on my data using rrarefy in vegan and looked at alpha diversity of particular samples, but I still want to calculate the distance between some samples. Should I run avgdist on my original data to calculate the distance between ALL samples, then run metaMDS on just the samples I'm interested in? Or should I run avgdist on just the samples I'm interested in? Also, is it improper that I would rarify using rrarefy to look at alpha diversity then rarify again to look at beta diversity? Should I be using the same rarified data for both analyses?! Sorry for all the questions! I'm new to microbiome analysis
Hi Bridget - I rarefy everything using the same “raw” count table for each analysis. For the ordination you only want to include the samples you’re interested in since it sets the center to (0, 0). I’d remove the extra samples before avgdist
Hi Pat, thank you so much for your videos! They are always very complete and didactic. I would like to ask a question, is it possible to calculate the Bray-Curtis similarity and then build a dendrogram using ggplot2? Could you make a video on how to build a BC similarity dendrogram?
Hey Pat great video and thanks for all your work on this channel. I am having an issue once I arrive at the `scores( nmds )` line. I get an error that states the following: "Error in x$species[, choices, drop = FALSE] : incorrect number of dimensions". Have you or anybody else encountered this?
I think they changed the way that the commands work together. scores was a helper function that can easily be replaced by using nmds$points instead. Thanks for watching!
@@Riffomonas Thanks! Yea, after troubleshooting and using the function on different datasets I was still getting the same error...it may be a bug, I guess...I really appreciate the response!
Dear professor Pat, I was just wondering if I can use a presence/absence data set for avgdist(). Wouldn't that be inappropriate as rarefaction is based on abundance data, not presence/absence?
Correct. You would need to find some way to control for sampling effort. Something like Jaccard would work for presence/absence but could be misleading with different sampling levels
@@Riffomonas Thank you very much, professor Pat. I have one additional question, do you know how I can extract the species and species scores from the NMDS created with avgdist()? It seems like I can only extract species scores if I use the abundance matrix itself, not the dissimilarity matrices created using vegdist() and avgdist().
Hi Pat, thank you for sharing! When analyzing for group differences in distances, do you always test for dispersion effects afterwards? will there be a video about this in the future?
@@Riffomonas Thank you! Your videoes are great and easy to follow! Even for a veterinarian with no educational background in these concepts. Much appreciated!


thanks for showing vegan %
mutate(day = str_replace(Group, ".D*, "", .before =2)
which will put the mutated column to a designated position, in the example above on position 2, just in front of the "old" column 2
so you dont need these select(1,2, everything() ) lines anymore
another thing I often use in the case of creating a "clean" OTU table is
column_to_rowname(., var = "Group")
this lets you stay in the tidyverse and piping :)
thanks for the awesome videos
Very cool. So many nifty options 😊
Very informative!! Thank you!! I usually attribute name to the object in the last dplyr function as " %>% as.data.frame(.) -> new_object" but I know it is little weird :)
Thanks for watching! I love the -> I fear It’s almost scandalous to use 😂
Same here :)
Its just so much more intuitive to me
Hi Pat! Thanks so much for the videos, I've just recently discovered your channel and it's been incredibly helpful for my learning process.
I'm wondering if you could clarify the need to calculate distance matrix before running NMDS? I have a species assemblage dataset from an underwater visual census (UVC). My data has a ton of zeroes and just like yours, a lot of columns (species). I've ran both NMDS without calculating the vegdist (+ automatic transformations) and with vegdist. They look similar but not the same. Thus I'm not sure which one to use for my publication. Why would you advice me against using the plot without prior calculation of distance matrix?
Also, seems like my data has a high stress (>0.2) when run with k=2. If I run it with k=3, should I be presenting the figure in 3D?
Thanks in advance!
Thanks for watching! First - please do not publish a 3D image on a 2D page 🤓 you need to use a metric like bray Curtis that ignores double zeroes. The default may be Euclidean which is frowned upon in ecology since it counts double zeroes as being similar
@@Riffomonas yes, I've been using bray curtis distance, and I only asked about the 3d question because of one annoying coauthor that insists of plotting a 3d graph 😅
so, should i not be running the metamds before turning my data into a distance matrix? I've also seen some examplea that turn their abundance data into relative abundance using decostand. I'm still not entirely certain why/why not i couldn't be using the nmds ordination with raw data.
Hi Pat, thanks for the nice vedio! when use nmds
Hmmm, I'm not sure - why are you giving metaMDS shared instead of a distance matrix? Could that be the difference between what you and I are doing? github.com/riffomonas/distances/blob/main/code/nmds.R
@@Riffomonas But at 12:27, you were using nmds
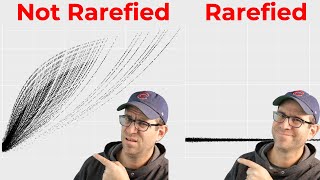
The rest of the video goes on to say that the defaults were not ideal and that rarefaction of the data was necessary
@@Riffomonas I see, thank you Pat!
How can I build a dendrogram with bray curtis dissimilarity in R?
I've never used it, but I think the ape package will make dendrograms
You really need to put `+ coord_equal()` or +`coord_fixed()` on your ordination diagrams created by hand. The Euclidean distance on the plot is some approximation to some other distance (in NMDS the rank order of the euclidean distance on the plot is intended to be a close approximation of the original distances between samples) and if you don't keep a fixed aspect ratio this visual distance interpretation is broken
Thanks - normally I do this but left it off here for some reason. I’ll be sure to mention this the next time I pick up the thread again
Great channel! I've been trying for months to learn some of these techniques from scattered sources and you're really helping me make sense of the mess of lessons I've tried to wrap my head around.
Hey Clifton - great to hear! I’m glad you’re finding these videos helpful 🤓
For an alternative to the usual rarefaction method, take a look at the SRS function in the SRS package. 1. Beule L, Karlovsky P. Improved normalization of species count data in ecology by scaling with ranked subsampling (SRS): application to microbial communities. PeerJ. 2020;8:e9593.
Thanks for watching and the paper recommendation. I used this on these data and found it behaved nearly identical to using relative abundance data which has its own set of problems namely that distances are affected by sampling effort. I’ll talk more about this in the next few episodes
Great explanation!! It will be awesome if you can reduce the talk speed a bit though...
Hi Samadhi - thanks for watching! It's hard for me to get the right speed of speaking and coding. Have you tried slowing down the play back speed and see if that helps any?
This is a great overview of using vegan for calculating distances and plotting them. Some nice additions (if you don't already have planned) would be to show how to pull out which variables (or species) are driving the spread on the plot and adding that data to the plot. You mentioned that the different clouds pertained to different days, so I'm assuming you're going to discuss that in another video.
Yeah I’m going to come back to that soon. Thanks for watching!
Just a note: we handle data frames of abundance data just fine in vegan's community ecology functions, including `vegdist()`. The only restriction is that you have to get rid of meta data (the `Group` column in Pat's data) from the data frame just like Pat showed in the video. You just don't need to do the last step of converting to a matrix.
Thanks!
Very helpful demo.. just wanted to clarify something. Why did you take sample=1800 at 14:36??
That is the number of sequences that each sample was rarefied to in avgdist
Hi Pat! This was super helpful. I've performed rarefaction on my data using rrarefy in vegan and looked at alpha diversity of particular samples, but I still want to calculate the distance between some samples. Should I run avgdist on my original data to calculate the distance between ALL samples, then run metaMDS on just the samples I'm interested in? Or should I run avgdist on just the samples I'm interested in? Also, is it improper that I would rarify using rrarefy to look at alpha diversity then rarify again to look at beta diversity? Should I be using the same rarified data for both analyses?! Sorry for all the questions! I'm new to microbiome analysis
Hi Bridget - I rarefy everything using the same “raw” count table for each analysis. For the ordination you only want to include the samples you’re interested in since it sets the center to (0, 0). I’d remove the extra samples before avgdist
Hi Pat, thank you so much for your videos! They are always very complete and didactic.
I would like to ask a question, is it possible to calculate the Bray-Curtis similarity and then build a dendrogram using ggplot2? Could you make a video on how to build a BC similarity dendrogram?
Thanks! I probably won’t come back to this thread of videos soon. I think there’s a gg dendrogram package or something like that
Hey Pat great video and thanks for all your work on this channel. I am having an issue once I arrive at the `scores( nmds )` line. I get an error that states the following: "Error in x$species[, choices, drop = FALSE] :
incorrect number of dimensions". Have you or anybody else encountered this?
I think they changed the way that the commands work together. scores was a helper function that can easily be replaced by using nmds$points instead. Thanks for watching!
@@Riffomonas Thanks! Yea, after troubleshooting and using the function on different datasets I was still getting the same error...it may be a bug, I guess...I really appreciate the response!
Dear professor Pat, I was just wondering if I can use a presence/absence data set for avgdist(). Wouldn't that be inappropriate as rarefaction is based on abundance data, not presence/absence?
Correct. You would need to find some way to control for sampling effort. Something like Jaccard would work for presence/absence but could be misleading with different sampling levels
@@Riffomonas Thank you very much, professor Pat. I have one additional question, do you know how I can extract the species and species scores from the NMDS created with avgdist()? It seems like I can only extract species scores if I use the abundance matrix itself, not the dissimilarity matrices created using vegdist() and avgdist().
Thank you so much for the great channel! 💙💙. your videos is super helpful... simply it is awesome😃
Hi Pat, thank you for sharing! When analyzing for group differences in distances, do you always test for dispersion effects afterwards? will there be a video about this in the future?
Thanks for watching! We usually do a test using the homova function in mothur
@@Riffomonas Thank you! Your videoes are great and easy to follow! Even for a veterinarian with no educational background in these concepts. Much appreciated!
I am so glad I found this video..