Anyone have anything to report back on their conversation with their PI or colleagues about using stacked vs grouped barcharts? Let us know what points were brought up!
At first broom::glance these videos may seem basic, but several of my peers sometimes struggle with formatting their graphs and this video can be really helpful in brushing up on the basics.
This is the best video. I always appreciate your teaching approach and explanation. please release videos on LULC or land use Land Cover Classification by using R. Thank You!
Hi. I was hoping to work in parallel with your video so I can learn how to apply this to my data, but am having trouble finding where the code is in the GitHub folder. Can you please tell me how to find it? Thanks.
Hi Allison - thanks for watching! If you go to the last 1/3 of this video, you'll see how to get the data for this set of videos th-cam.com/video/D6CunpqF04E/w-d-xo.html
@@Riffomonas Thanks. That was helpful. However, I was looking for the code. But I just noticed the link to the blogpost that you linked above that contains the code and copied and pasted it. I assume that's the best way?
Hi! thank you for a great video, very helpful. I tried to add errorbars, but the errorbars center in the middle as though it is still a stacked bar chart. Is there a way of separating the errorbars and get them to center over their respective bar? I hope my question makes sense.
thanks, this is very helpful. Can I kindly request you if you could please put the details on how we can add ANOVA statistical significance as numerical or as asterisks above each grouped stacked bar.
Thanks for the question - It would be the same idea as was covered in the "Adding lines and asterisks... (CC093)" episode. The difference would be that instead of adding the stars and bars to a jittered plot, you would be doing it over a bar plot
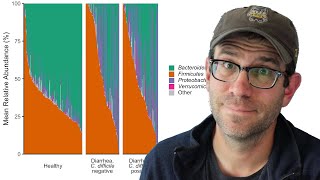
How would I be able to change the order of the bars and the legend? Say for example, if I wanted to make "Healthy" the 3rd one down on the legend, and the third one in each group of columns? Like if I wanted the order to be Diarrhea, C. difficile positive; Diarrhea, C. difficile negative; Healthy?
Hi, I have one question. How can we arrange the bars' position under the same variable. What if I want to swtich Healthy to the right, and Diarrhea C. to the left? Thank you!
My grouped bar chart doesnt keep the order from column to column. I have searched everywhere and I still dont have a solution. Do you know what could be the problem ?
@@Riffomonas I tried to factor the fill variable but the wrong column switched too, so the problem is the same. While reading issue 1472 on ggplot2 I didnt get much answers eitther because a answer wasnt provided to the last guy that replied to the thread that seemed to have the same problem as me.
Are you using stat=“identity” with geom_bar? Why not use geom_col without stat=“identity”? Sorry TH-cam comments is a rough place to address issues like this
Thank you for the video. I just have a question regarding saving the output graph. I used R markdown and set the graph dimension ,fig.height = 8, fig.width = 6 for example, to have a good size of graph. Of course, the font size are also adjusted in function of the dimension of the graph. However, when I used ggsave. The font size become much smaller, almost every thing. Could you give me some hints with that issue. I appreciate your help. Thank you!
Hi - this is why I only use ggsave to generate my figures 🤓 make sure you’re using the same format of images in rmarkdown and ggsave. If you’re doing pdf in one and png or tiff in another things could go wonky. Also make sure you’ve got the same units on the dimensions
this video was so helpful! I have a question a made a facet graph with 16 small graphs, is there a way to separate them onto 16 different pages for easier viewing?
Hi Tyler - thanks for the question! Hmmm, I think the easiest would be to generate the figures separately using filter to subset on the variable that you would facet on. You could use something like map or a for loop to iterate over the different subsets
Hi, your videos were very helpful to make figures with my own data. I made the relative abundance plot with geom_col but the plot were stacked by alphabetic order. Is there a way to reorder the stacked plot by legend order?
Hi - I'm not a fan of stacked barcharts (see the other videos where I cover how to make stacked barcharts). I talk about this topic in those videos, but the gist of it is that you need to reorder the groups to be in the order you want using factors. The order of the legend will be set in scale_color_manual.
Is there somewhere that you go over in detail how to change the bar/column order? My grouped bars are alphabetical and I can't seem to change it. Thank you


![CAMPปลิ้น | EP.83[2/2] ประสบการณ์ขนหัวลุกจากตำนานวงการผี!](http://i.ytimg.com/vi/T_kFecQw7Ds/mqdefault.jpg)

![ไข้ขึ้นเลย! เมื่อแฝดโดนจัดเต็มวัคซีนครบ2เดือน🤒 [cc] แดนแพทตี้ SS2 | EP.54 |](http://i.ytimg.com/vi/z2VHItnyyvY/mqdefault.jpg)

Anyone have anything to report back on their conversation with their PI or colleagues about using stacked vs grouped barcharts? Let us know what points were brought up!
Hi can you give me your email , I need help for creating bar chart for tow variables
At first broom::glance these videos may seem basic, but several of my peers sometimes struggle with formatting their graphs and this video can be really helpful in brushing up on the basics.
Ahhh, you noticed :) Thanks for watching!
This is the best video. I always appreciate your teaching approach and explanation. please release videos on LULC or land use Land Cover Classification by using R. Thank You!
Very good tutorial thanks very much
My pleasure- thanks for watching! 🤓
Thank you for these very helpful videos!
My pleasure!🤓
Hi. I was hoping to work in parallel with your video so I can learn how to apply this to my data, but am having trouble finding where the code is in the GitHub folder. Can you please tell me how to find it? Thanks.
Hi Allison - thanks for watching! If you go to the last 1/3 of this video, you'll see how to get the data for this set of videos th-cam.com/video/D6CunpqF04E/w-d-xo.html
@@Riffomonas Thanks. That was helpful. However, I was looking for the code. But I just noticed the link to the blogpost that you linked above that contains the code and copied and pasted it. I assume that's the best way?
Hi! thank you for a great video, very helpful. I tried to add errorbars, but the errorbars center in the middle as though it is still a stacked bar chart. Is there a way of separating the errorbars and get them to center over their respective bar? I hope my question makes sense.
Hey August - can you try adding geom_dodge to the geom you're using for the errorbars?
thanks, this is very helpful. Can I kindly request you if you could please put the details on how we can add ANOVA statistical significance as numerical or as asterisks above each grouped stacked bar.
Thanks for the question - It would be the same idea as was covered in the "Adding lines and asterisks... (CC093)" episode. The difference would be that instead of adding the stars and bars to a jittered plot, you would be doing it over a bar plot
How would I be able to change the order of the bars and the legend? Say for example, if I wanted to make "Healthy" the 3rd one down on the legend, and the third one in each group of columns? Like if I wanted the order to be Diarrhea, C. difficile positive; Diarrhea, C. difficile negative; Healthy?
Hi, I have one question. How can we arrange the bars' position under the same variable. What if I want to swtich Healthy to the right, and Diarrhea C. to the left? Thank you!
My grouped bar chart doesnt keep the order from column to column. I have searched everywhere and I still dont have a solution. Do you know what could be the problem ?
Thanks for watching and asking! Maybe you need to set the variable as a factor with your desired order
@@Riffomonas I tried to factor the fill variable but the wrong column switched too, so the problem is the same. While reading issue 1472 on ggplot2 I didnt get much answers eitther because a answer wasnt provided to the last guy that replied to the thread that seemed to have the same problem as me.
Are you using stat=“identity” with geom_bar? Why not use geom_col without stat=“identity”? Sorry TH-cam comments is a rough place to address issues like this
@@Riffomonas It gives me the same results . Im doing like this
df$Paises
Thank you for the video. I just have a question regarding saving the output graph. I used R markdown and set the graph dimension ,fig.height = 8, fig.width = 6 for example, to have a good size of graph. Of course, the font size are also adjusted in function of the dimension of the graph. However, when I used ggsave. The font size become much smaller, almost every thing. Could you give me some hints with that issue. I appreciate your help. Thank you!
Hi - this is why I only use ggsave to generate my figures 🤓 make sure you’re using the same format of images in rmarkdown and ggsave. If you’re doing pdf in one and png or tiff in another things could go wonky. Also make sure you’ve got the same units on the dimensions
Thanks 👌
🤓
this video was so helpful! I have a question a made a facet graph with 16 small graphs, is there a way to separate them onto 16 different pages for easier viewing?
Hi Tyler - thanks for the question! Hmmm, I think the easiest would be to generate the figures separately using filter to subset on the variable that you would facet on. You could use something like map or a for loop to iterate over the different subsets
Hi, your videos were very helpful to make figures with my own data. I made the relative abundance plot with geom_col but the plot were stacked by alphabetic order. Is there a way to reorder the stacked plot by legend order?
Hi - I'm not a fan of stacked barcharts (see the other videos where I cover how to make stacked barcharts). I talk about this topic in those videos, but the gist of it is that you need to reorder the groups to be in the order you want using factors. The order of the legend will be set in scale_color_manual.
Is there somewhere that you go over in detail how to change the bar/column order? My grouped bars are alphabetical and I can't seem to change it.
Thank you
thanks
My pleasure!
This guy is just doing these videos because he is trying to show off his knowledge.
Hah! I love this stuff 😍