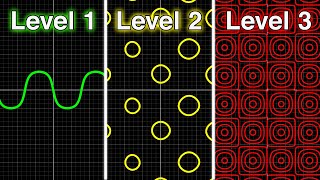
Sine graphs but they get increasingly more AMAZING

ฝัง
- เผยแพร่เมื่อ 5 ก.พ. 2025
- Here are my collection of amazing math graph with only sine function.
I use DESMOS to plot these graph.
Here is the link to the graphs so you can play with them yourself : www.desmos.com...
Music:
Ohayo by Smith The Mister smiththemister...
Smith The Mister bit.ly/Smith-T...
Free Download / Stream: bit.ly/_ohayo
Music promoted by Audio Library
• • Ohayo - Smith The Mist...
Help support this channel by subscribing and hitting the like button.
Also check out my other collection of beautiful math graph:
Polar Graphs : • Polar Graphs but they ...
Math is Art : • Math is Art
Math is Beautiful : • Math Is Beautiful
Thanks for Watching.
Note:
I made a mistake in the video. I said that I only use the sine function, but that's not true. its not that i only use sine function, but more like 'I'm only using the sine function out of all other trigonometric functions." I hope this clears up all the confusion.


Note:
I made a mistake in the video. I said that I only use the sine function, but that's not true. its not that i only use sine function, but more like 'I'm only using the sine function out of all other trigonometric functions." I hope this clears up all the confusion.
U forgo cos in da vid
@@xorvrGTAG1
TF are you saying?
@@RailsofForney "you forgot cosine in the video"
@@xorvrGTAG1 sin(x+π/2) is equal to cos(x)
@the-mathwizard how do I make your profile picture as a graph?
I'm a musician and I was 100% expecting to hear these waves
if you're really a musician, name every song
Variations on the C Major Scale
@@calengo454 bruh what?
@SeeJay-ji7tqwhat about songs in microtonal tunings?
@SeeJay-ji7tq what about music that doesn't use western tuning?
nothing could've ever prepared me for how smooth y = sin(x) + sin(y) was
2:13 ye
I wish these could be rendered with full detail
i second this
Eh, working with Desmos you get used to it
Maybe GeoGebra could work?
if they actually could the line would be infinitely thin so invisible so a blank paper is a render with full detail kinda
Try buying a Raspberry Pi because the full version of Mathematica is free for the RPi. I’m guessing that it would do a better job of rendering these.
"At this point you know I'm obsessed with number 9"
Words of a Cirno fan, no doubt
Yuck, i could smell this touhou fan from a mile away
Deodorant aisle is that way
9 is beautiful, as it is the place value limit in our base 10 system. 9 does a lot of beautifully interesting things
@@甘いお茶漬けor you could just *leave?*
this is so cool and such a vibe with the music and little inbetween captions
I'm glad that people like slower, simpler, and calmer videos. Thank you.
fancy seeing you here looser, apparently we get recommended the same cool videos from smaller channels
@@the-mathwizard tbh anything slow is bound to bring people relief from the endless tiktok crap
4:40
This is someone who has seen the true power of sine.
🤯
the true power of sinning
I particularly enjoy y = x • tan(x²+y²), it makes a very nice spiral
You are right! owo
That's amazing.
I also like this one a lot, it doesn't look like something that would behave so nicely, even desmos has trouble rendering it. Why it creates a spiral becomes clear when we convert it to polar coordinates, we get theta = r^2, or r= +/- sqrt(theta). I also didn't expect it to be so simply expressed in polar.
i put a nice render of it on imgur a/7yRULrG
Nice
Changing it to y = x + tan(x²+y²) is pretty funny compared to that
A lot of these graphs look like that because of the limitations put on how precise they are to the real thing (since points are infinite therefore not every single can be rendered). It can be seen with the small missing pieces that should be there but aren't rendered.
@erin1569 -- I have often thought the same. I made my own graphing rendering decades ago, and have since recoded it on today's supercomputer PCs to be real-time, and comparing the output to online renderers shows that they make an attempt to "connect the dots". I have just uploaded a video with this video's equations shamelessly taken to see the difference, and to test my asymptote calculations. Have a look. Nyquist frequencies are still hit, which can be fun to look at, but it ultimately does not achieve the goal of showing "where are the solutions?"
imagine if we could see this in the complex plane
Loving this idea!
this comment aged like milk
@@Twentycns how so?
there is a complex plane in the complex mode _(specifically in desmos graphing calculator)_
As an aspiring Electronics engineering student I appreciate this visual representation
You somehow brought emotion to showing sine graphs and thats so cool
WE ABOUT TO LEARN _SINE_ LANGUAGE WITH THIS ONE
nice puns!
@@the-mathwizardbut still how do I make your profile picture as a graph?
How do I make it
A lot of these are good easter egg designs
4:06 is just sin(x)=sin(y) and 5:27 is just xsin(x²+y²)=1
(Except the forms shown in the video also have y=0 superimposed as a result of multiplying both sides of the equation by (y-0) )
Amazing 🤯I saw someone send the equation for a heart on a valentine card, but this is on another level. Please more.
i love the little comments with each function they’re so cute
Did i just make math cute?
@@the-mathwizardYou come from heavens if you can achive that, you must be Acute angle!
@@aeuludag..
Start: normal sine waves
Middle: cool
End: chaotic
it goes wibbly wobbly
2:11 my toxic trait is thinking i can figure out how to approximate this as only a function of x
00:11
Sine Wave
00:32
Frequency * 9
00:41
Magnitude * 9
00:52 & 01:01
Pitch Envelope
01:12 & 01:22
Magnitude, Phase, and Harmonics
Math wizard be like:
I'll have 2 number 9's a number 9 large
9
6
9
6
9
I like these videos cause before the graph shows I take some seconds to think how the function will be, pretty interesting, keep up the good work
Seeing y=sin(x^2) and seeing so clearly that for x~0 sin(x^2)~x^2 (the freaking parabola in the middle) and also noting it for all the other functions was so cool. I know it’s banal but that’s the beauty of math.
You could try "y=sqrt(1-x^2)*sin(10x)", it makes a sine wave that fits inside of a circle
It’s pretty cool that for any sine function, let’s say f(x) for example, whenever you multiply x and y it always leaves a line of non values around the origin that “cuts” the graph in two, almost like an asymptote in a hyperbolic function.
4:09 Is actually really interesting: y = y * sin(x)/sin(y) simplifies to sin(y) = sin(x), which can be solved to y = x + 2*pi*k, where k is any integer between -infinity and +infinity, giving a bunch of diagonal (y=x) lines spaced 2pi apart. Since sin(-alpha) = -sin(alpha) = sin(alpha + pi), this can also be solved to -y = x + pi + 2*pi*k or y = -x + pi + 2*pi*k, where k is once again any integer between -infinity and +infinity, giving a bunch of diagonal (y=-x) lines spaced 2pi apart, but translated by a factor of pi.
🤓🤓
😎😎
I do this all the time. I'll choose a function and guess what the graph will do as I add things. I am not alone!!!
Such a nice video. Thanks for sharing cool functions you've found
Of course brother, you're welcome
My personal favorite sin curve is |sin((pi/2)x)|=y^2 because it makes a chain of what looks like perfect circles
Note: if you put "k" variable instead of nine, then the equation is: y=(sin(kx))+sin(x). And then you can make an animation of it
Great vid!!
I love the part where the graph said “it’s cubin time” and then cubed all over the place
1:00 IT'S CUBIN TIME!!!
It's been nine days since this has been posted and I got reccomended it.
I like 2:00 Because this reminds me of how AM radio waves are transmitted. Kinda just a sine wave riding a sine wave.
“Damn son” is my only reaction 😂
I’m in grade school and we use Desmos for our calculations, so whenever I get bored, I just go to Desmos and do something dumb, until it creates beauty like this.
Bro this is awesome.
at 4:06 y=y*sin(x)/sin(y) simplify by y and you get 1 = sin(x)/sin(y) and then mutiply by sin(y) and you just get sin(y) = sin(x)
The 4:05 graph is simple, sin(y)=sin(x)
Beauty lies in simplicity
@@the-mathwizardya I know, just pointing out
With the minor difference that sin(y) != 0 => y != kπ
Start: 🥱
Between Start and Middle: 🤔
Middle: 😮
Between End and Middle: 😲
End: 🤯
super nice man
Now put sum function at the beginning n=x and put any number on top
2:20 bro thats just tangent
I can assure you it’s not.
Y= Sin(9x)+sin(x) is what i call fractal sine or sine sine where the small sine wave from a big sine wave
Well try this sin(floor(x)×x)
You should edit this as an sin(x) Iceberg!
4:05 the Ys cancel so ur basicqlly just solving sin x = sin y which will just be periodic straight lines
wtffff bro thats amzing
Awesome video! 👌
Some of these are super cool and some of them make me viscerally uncomfortable with how imperfect they are
I wish you could do a f(x,y,z) sine function version, so we could see cool three dimensional versions of this.
sin(xy) is already three dimensional, in fact, a third variable would make the plot 4 -dimensional (though this would be impossible to represent). The reason why you see the xy functions in a plane in this video is that we are just seing a “level curve” (as if you cut the function at a certain height).
5:40 I was expecting the roblox epic face because “it’s over 9000” and that reminded me of “zomg so cool, but it’s ovah 9000”
naah, this is the true "it's over 9000" moment: th-cam.com/video/SiMHTK15Pik/w-d-xo.htmlsi=Zo_H0dJSCMw8ZALo
Funny enough, that's a meme based on a meme.
The original comes from an early English translation of Dragon Ball Z.
Would be cool to change the 9 by a variable and then animate that variable to go from 0 to 9. So that you can see how the figures form
That's a topic for a future video.
Friendly reminder that math is freaking cool
this is so cool
ay try the dancing one - c = b tan(cos(x1)x)
AMAZING VIDEOOO
I’m not even going to pretend I understand why those graphs can be made 😂
This was amazing, math wiz! do you have one with cosine? I had so much fun! I went from ABSOLUTELY hating trig to watching videos like these for fun!
1:00 Yay cubin time po!
I want to see this in Desmos 3D now
Learning sine waves 😪
Visualising it : 🤩
You can do some equally interesting things with nested trig functions as well
4:08 That one makes sense actually; cancel the "y"s
Let me toss you this one: sinx + sum from n=0 to infinity of n/10^n sin10^nx. Zoom in as much as you like, it will still look like a sine wave
I just tried plotting the graph, but after zooming in a couple times, it's not looking much like a sine wave. Could it be that I've entered the function incorrectly?"
idk what im gonna do with this but at least now i know that i can confuse anybody without a phd in math with y=sin(xy)
can anyone explain or link to smthn that explains how a graph can have multiple y values?
With the ones where there’s a y term on the RHS as well as the LHS being equal to y- how does that work? Is the graph not showing a function but just the set of all solutions to that equation? (I did a maths minor at uni but that was a couple years ago)
Yes, pretty much. You can simplify these equations to y= something, although the resulting formula definetely will not look as nice. Often enough it will also not fulfill the requirements of a function (each x-value is assigned to at most 1 y-value). Instead of that, the equation might be fulfilled for all y>x or similar.
It uses a numerical method to scan for all pairs (x,y) that solve the equation.
Coming up with such a numerical method is really cool and a fascinating problem. I recommend you read, at least the start of a wonderful introduction to Tupper's Algorithm: www.dgp.toronto.edu/~mooncake/thesis.pdf
1:30 ok NOW it gets awesome
y=sin(9x)+sin(x) looks so satisfying
Magic!
Bro I just started my trigonometry unit in geometry, this is cool
When I was trying stuff, I liked what sin²(x)=tg(y²) looked like
3:40 better infinity is "sin(x) = sin(y)!" (! - factorial)
you're goddamn right, how could I forget to add factorials
Me when I get to class to do my maths test and I have to graph y=x•sin(x²+y²): 😮
(I'm going to humilliate myself more than ever)
(cos(x)*cos(y))^(1/3)>=sin(x)+sin(y)
Please try inverse functions
I’m curious to how the computer is able to calculate y=sin(xy) since the dependent variable is in the equation
Desmond uses some numerical method to scan for all pairs (x,y) that solve the equation.
Coming up with such a numerical method is really cool and a fascinating problem. I heartily recommend you read, at least the introduction to Tupper's Algorithm: www.dgp.toronto.edu/~mooncake/thesis.pdf
isolate y or use a parametric
i think it'd look better if the transitions were immediate, the function could be in a small box somewhere
I was shocked at y = sinx + siny because I thought that finally I found the "circular-sloped" sine wave when I noticed at the same moment that it's not.
What I mean by "circular" sine wave is that when every section is a perfect half circle.
Does such a wave exist?
The third one in the thumbnail looks extremely scary
amazing video ❤, but switching from black background to white one so often hurts my eyes, would be better if it was only black or only white 😅
no way this has only 1.7k, i thought this would be viral lol. even if you don't like math it's super cool
Thanks, soon those "k"s will turn to "m"s
y=Sin(x^x)+sin(x) is my favorite (explicit too!)
When I tried the y=sin^3(x) in Desmos, I got an error saying “Only sin^2 and sin^-1 are supported. Otherwise, use parens.”
How unfortunate, still looks pretty cool on your end.
sin^3(x)=sin(x)^3
Very cool!
2:01
ITS THE KEYS
🔑 🔑
🔑 🔑
🔑 🔑
🔑 🔑
If you replace the number 9 with a higher number, you'll get even wigglier graphs
From normal to absolutely chaotic
Desmos is cool but Mathway graphing calculator renders the graphs much more precisely. Maybe give it a try.
y=y sin(x) /sin(y) looks like a linear transformation
Can we prove that those lines are lines indeed?
y = y sin(x) / sin(y)
1 = sin(x) / sin(y)
sin(y) = sin(x)
y + 2πn = x + 2πm; n, m are integers.
y = x + 2π(m-n)
When n = m = 0
y = x
So yes, those are lines. The 2π(m-n) term gives the graph its periodicity.
@@adiaphoros6842 I see. By the way, you ought to be careful when simplifying by y at the beginning since you can lose solutions. There is another line you are missing, the y=0 axis
Other than that, nice proof
add 1 to that and look at the graph :)
Sine + sawtooth be like: 1:20
5:37 hell yea, dbz meme let's gooo!!!
You can make infinite infinities with 'sin(X)!=sin(y).
This video uses only sin, but cos looks better in my opinion because it's centered.
2:24 dude you can't fool me that's bacon
Intrusive thoughts winning 💀
real
What i dont understand
y=2^{2sin(2x)}-2cos(y)
For a row of... *special items*
or replace the second 2 with 4 for some tall chess pieces.
Sine function on LSD!
Number 9 is the main character
Sure it is, agent 009😎
This is what the Beatles were talking about
Number 9, Burger King Foot Lettuce.
Normal graph: 😒
Graph with 9: 🤩
Have you checked out Fourier transforms?
It's a bit difficult, but I'll try that in the future