Chapter 8 Video 1 - Bar Plots with One Variable in R (with ggplot2)

ฝัง
- เผยแพร่เมื่อ 7 ต.ค. 2024
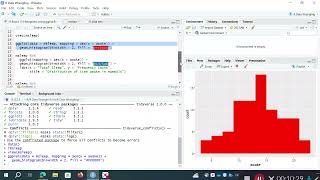
- In this video, we create a bar plot with one variable in R using the geom_bar() function from the ggplot2 package.
This is the 1st video of Chapter 8 for the book Quantitative Social Science Data with R, 2nd Edition (Sage).
April 2023 Update: Data & codebooks are now available for these R tutorials: study.sagepub....