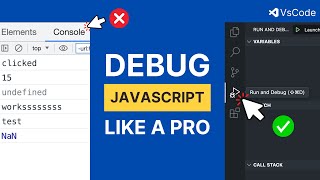
Chrome Debugger is BETTER than you might think

ฝัง
- เผยแพร่เมื่อ 31 ก.ค. 2023
- Everyone uses console.log all the time, but if you want to look smarter 🧠 when doing pair programming or sharing your screen, here’s a Chrome’s debugger video. Thank me later 😉
Jokes aside, unless you really just need to peek at one value, using the debugger gives you much more context and awareness while debugging your application… and you won’t end up having 7 logs here and there flooding the console.
With Chrome you don’t even need to setup anything. It just works, and you get for free features like conditional breakpoints, watching values, and if you really like logs… you have logpoints!
_______________________________
Hit like and subscribe for more content! :D
Join the Discord community! Here's the invite: / discord
You can also follow me on the other platforms:
Twitter: / balastrong
dev.to: dev.to/balastrong
Home: leonardomontini.dev/
TikTok: / balastrong
GitHub: github.com/Balastrong
Instagram: / devbalastrong
_______________________________
Sound effects from www.zapsplat.com
#debugging #devtools #javascript - วิทยาศาสตร์และเทคโนโลยี


![[TH] VALORANT Champions Seoul - Group Stage Day 6 - EDG vs G2](http://i.ytimg.com/vi/vS-fmO6SAjY/mqdefault.jpg)

Super helpful, why did I not know about this features until then !! Thanks a lot, that will clearly change the way I write js and ts !
Great to hear you liked it! Good news, you can also use vscode to debug your application, I'll probably make a video about it soon :)
Very nice video, I feel like there's no real consensus on how to debug other than console log etc and also not many videos that cover it online. I learned a lot 😃
This is such a useful video. Thank you i am new to front end and react. debugging is essential and how to do it efficiently is something that should be learned first. Glad the yt algo suggested this video.
Thank you for the kind words! Also thanks to everyone subscribing and leaving a like on the video, this makes the algo to suggest it to a wider audience :D
Love to hear my content is helpful!
Great video Leonardo! Thanks a lot!
Extremely useful video. Thank you for making this!
Thanks, glad to hear that! :D
Great video. This will save me a lot of time!
Thanks! You're gonna love the debugger :D
Very well organized and works equally well on VSCode!
Yes! Thanks for the comment :D
Great video
One thing that I'd add is "never say never" 😉; using `debugger;` could be useful in a couple of use cases: you're not familiar with the code, so you don't know exactly where to put the breakpoint. Or, you have no idea why a line is being executed, so putting `debugger;` in there would definitely help
Thanks! That's true, in those two situations it can be quite useful :D
Super helpful, thank you!
Will you use the debugger now? :D
@@DevLeonardo Yes absolutely!
Very useful video, thanks
Thank you, feel free to have a look at the other videos in my channel :D
very helpful. thank you
Happy debugging!
if ur in dev tools ctrl + p goes to find file, else it goes to print
Ah, right!
wwhat if your app is bundled
If it has sourcemaps should work anyway (vite bundles your app) or if you want a completely different plan, you can debug directly in vscode: th-cam.com/video/FOXNlZFkbPk/w-d-xo.html