i have bought classes but my teacher explanation was not so good , after watching many different videos i find this THE BEST. Thankyou for making this video
beautfil explanation sir , every one teaches formula and complete explanation but you have explained why this formula dn explained it in very detailed manner thankyou sir
Hey I am data scientist too and really like your content . Can you make a video about how to select (statistically) control group size for marketing campaign?
Thank u so much I m.doing msc buisness analytics from Scotland seriously for every questions that hit me I come to ur channel I m.ur new subscriber God bless you
Hey I have a doubt. When you change the value of a y variable from 32 to 48 .. Will it mean remain same that means mean will not change? If change then how can you subtract the previous mean from the new value of y?
How the new data is handled after the model is moved to production. Example: During model development the categorical data is converted to 1 and 0 using one hot encoding... When the new data is applied in production how the categorical data or text data is processed..
Does not matter if your sample size is large. See these answers: math.stackexchange.com/questions/2936143/do-i-use-n-or-n-1-as-the-denominator-for-covariance
Dear sir, I am not getting it properly, kindly explain in detail both with detailed calculations... Thank you so much for making the tutorials. Could you please add graphs also with it so it will clear more...
Great work .. These two terms were alien for me and the online website have complicated it more. Thanks to you I have understood it completely. just a single doubt , I have seen in many websites the denominator for variance is taken N-1 and in your video its N . which one should I go for
Amazing explanation. Please keep doing the great work. This channel deserves more!!! I have heard that before training a ML model, it is advised to remove highly correlated features, Can you explain why?
Pls clear my doubt.covariance is the way two variables move. Whether positive or negative but what is correlation of those Variables. How much have they moved ? Like if covariance is nearby to -1 then the two variables move in the opposite direction?
Thanks much. In last formula, you mentioned (standard deviation of x) ( standard deviation of y ) in denominator. How we will calculate and can you explain.
i would like to compare the advances level in banks. is covariance useful to compare the gross advances of public and private sector banks for 10 years.
Thank you for the video Aman...if four features are positive correlated and four features are negative correlated out of 10 features in dataset...what should we do...I mean which are needs to be dropped and why?
What purpose Covariance value / number is serving ? If I say sign of Covariance tells nature of relationship and Covariance value tells strength of relationship and there is no need of correlation .... how is this statement wrong ?
Great presentation that is simple and to the point. However could not fully grasp when calculating correlation, dividing cov(x,y) by sd x multiplied by sd y yields a value between -1 and 1. Why so? Kindly revert.
The explanation will be little more mathematical, please see the discussion here Saurabh: math.stackexchange.com/questions/564751/how-can-i-simply-prove-that-the-pearson-correlation-coefficient-is-between-1-an


In the formula of cov(x,y) the denominator is N-1 . Can you please correct this sir!
I will pin this on top of the video.
actually if you are applying this formula on sample then its N-1 otherwise if you are applying on population then its N.
@@pkavenger9990 thanks
Access Hindi, English courses here- www.unfolddatascience.com/s/store
Plz register on the website
with in a 1:30 sec.... i can say, you are the best teacher.
Thank you Jigyasa. Your comments mean a lot to me
i have bought classes but my teacher explanation was not so good , after watching many different videos i find this THE BEST. Thankyou for making this video
You are a Genius Sir. Thank You So Much for making these Concepts Simple and Lucid. May God Bless You 🙏🙏💐💐
You are amazing at what you do! Your passion and dedication is beyond words! Thankyou so much sir.
Thanks Gayatri for motivating me through your comment.
You nail it in every your videos . You sell the simplified knowledge . Keep it up and may God bless you.. Can't wait for more such videos :)
Thanks Prasad for motivation.
Just watched it before exam and in one go ,i understood the concept ❤keep making such videos sir 🥰🥰
beautfil explanation sir , every one teaches formula and complete explanation but you have explained why this formula dn explained it in very detailed manner thankyou sir
You are simply the best! The MasterBlaster in Data Science
Thanks alot Thurab. Continue watching
how calm u r while talking man ,excellent explaination! Hats off 🙇♂
You are the best teacher! Got goosebumps while listening to your lecture. Thank you so much!
Thanks Kavya. Pls share with friends as well. Keep learning
Amazing video! Such simple explanation, you earned a loyal subscriber today :)
Amazing explanation Aman bhai ... Made it sound so simple. Thanks this helps.
Thanks Jishnu da.
Was amazing. Happy to find your tutorials on TH-cam.
Thanks Soheila.
Kaafi achhcha samjhaya bhai! Good work!
Thanks Rishabh, thoda share kar dijie apne groups me :)
IT'S REALLY AN EASY CLASS AND THE WAY OF YOUR PRESENTATION IS GREAT.
Awesome video sir...Keep shining😀
Beautifully explained!!...Thanks for such content
Thanks Sameer.
Hey I am data scientist too and really like your content . Can you make a video about how to select (statistically) control group size for marketing campaign?
Thanks Aditya. Let me think through it. Thanks for asking.
after so much of head banging finally I understood covariance & correlation....thank you so much...
Thanks a lot.
very helpful...good job
Thanks a lot.
Thank you so much! it was hard for me to understand this concept until I found this video. Please keep doing more videos!
Thank you Yohari! Will do!
Amazing explanation brother..Good Job..👍👍👍
Thanks for the wonderful explanation. You made my understanding very concrete.
Welcome Vidya.
wow... What a explanation
Thanks Kiran.
Thank you sir. You're a great teacher.
Welcome.
Thank u so much I m.doing msc buisness analytics from Scotland seriously for every questions that hit me I come to ur channel I m.ur new subscriber God bless you
Thanks for your words Huma.
Hey I have a doubt. When you change the value of a y variable from 32 to 48 .. Will it mean remain same that means mean will not change? If change then how can you subtract the previous mean from the new value of y?
Let me check once.
Changing the value of Y variable from 32 to 48 changes overall mean of Y and hence it cannot be subtracted from the previous.
Thank you sir for clean explanation.
sir, when you have changed 32 as 48 then the mean also should change . So, it will effect all the variances in numerator , not only the last one.
yes same doubt
Loved it 😊! you made it very easy to understand thanks !
Very well explained
Nicely explained again Aman!
Glad you liked it Tushar.
Perfect 👍👍👍👍
Thank you
You are amazing buddy you explained it so simply
Thanks Vinay for your positive feedback. Please share with others as well who could be benefited from such content.
fantastic channel, def deserves more views
Thanks Haidi.
Excellent thanks!
You're welcome!
Very well explained, thanks
Excellent video
Thanks Bala.
How the new data is handled after the model is moved to production. Example: During model development the categorical data is converted to 1 and 0 using one hot encoding... When the new data is applied in production how the categorical data or text data is processed..
good question, u encode again and then predict.
Thank you Aman❤
Amazing explanation sir.....
Great resource!
Thanks a lot.
You made it so clear....thank you so much 🙏❤️
Welcome
Thanks a lot for this topic.
Welcome again :)
Perfect explanation
Thanks Matthew.
Good work bro ur teaching style is very cool, keep posting such great content
Thanks Anurag.
Sir.. Divide by N Or (n-1) for finding convariance? In some lectures it is showing as by ( n-1)
Does not matter if your sample size is large.
See these answers:
math.stackexchange.com/questions/2936143/do-i-use-n-or-n-1-as-the-denominator-for-covariance
@@UnfoldDataScience then, will it matter if it’s the case of small data set..?
What should we take then.??
Thanks a lot . A very detailed explanation . Great yaar🙏👍👌
Glad you liked it.
Thank you! Great teacher!
Helpd me a lot!
Thanks bro 👍
Welcome Salman.
Dear sir, I am not getting it properly, kindly explain in detail both with detailed calculations...
Thank you so much for making the tutorials.
Could you please add graphs also with it so it will clear more...
Much needed,thanks :)
Welcome :)
Great work .. These two terms were alien for me and the online website have complicated it more. Thanks to you I have understood it completely. just a single doubt , I have seen in many websites the denominator for variance is taken N-1 and in your video its N . which one should I go for
For population data N is taken and for sample data N-1
Glad it helped!
Thanks Rahul
it is good keep it up
V good, thanks
Thanks...this is very clear.
Glad it was helpful!
Best explanation
sir ur doing great work luv u
So nice of you
finished watching
Amazing Aman
THanks Karthick
Amazing sir thank you
Most welcome Soumya.
Amazing explanation. Please keep doing the great work. This channel deserves more!!!
I have heard that before training a ML model, it is advised to remove highly correlated features, Can you explain why?
Hi Sanjeev, I created a detailed video for this question, Watch it on my channel today 7pm IST. :)
@@UnfoldDataScience Thanks a lot!
very well explained.. 👍
Thanks Lakshay.
Pls clear my doubt.covariance is the way two variables move. Whether positive or negative but what is correlation of those Variables. How much have they moved ? Like if covariance is nearby to -1 then the two variables move in the opposite direction?
Great content 🔥🔥
Appreciate it Priyam
Thank you Amen :-) :-)
Welcome
Thank you
Welcome.
When Yi value is changed from 32 to 48 mean of y will also change
it helped me a lot, thank you🙌
Glad it helped!
Why covariance is divided by standard deviation?
When you changed 32 to 48, mean will also change.
mean will also change if 48 is made new observation
nicely explained. thank you!
Glad it was helpful!
Sir, one question..
If we change the value the y from 34 to 48 than also the mean will be changed again?
Its an confusion pis clarify
amazing explination
Thanks Madhu.
Thank you so much... It helped a lot... But i want to know why it ranges between 1 and - 1 and not above that...
Welcome Shubham, its because of internal mathematical formula.
Thanks much.
In last formula, you mentioned (standard deviation of x) ( standard deviation of y ) in denominator. How we will calculate and can you explain.
watch variance and sd video
i would like to compare the advances level in banks. is covariance useful to compare the gross advances of public and private sector banks for 10 years.
May be you can use advance technique. Its a simple technique.
Thank you for the video Aman...if four features are positive correlated and four features are negative correlated out of 10 features in dataset...what should we do...I mean which are needs to be dropped and why?
Good question Sudheer. To keep it short, choose the variables which are highest corelated with your target variable(Either positive or negative).
Please make video on statistics for data science A-Z
th-cam.com/video/iZ2r7aIwMbc/w-d-xo.html
What purpose Covariance value / number is serving ? If I say sign of Covariance tells nature of relationship and Covariance value tells strength of relationship and there is no need of correlation .... how is this statement wrong ?
Good question, however covariance is base of correlation hence that concept came first.
why exponential is calculated can you please explain that as well.
The unit you are talking about in covariance is +ve and -ve ??
ya.
thanks sir
Great presentation that is simple and to the point. However could not fully grasp when calculating correlation, dividing cov(x,y) by sd x multiplied by sd y yields a value between -1 and 1. Why so? Kindly revert.
The explanation will be little more mathematical, please see the discussion here Saurabh:
math.stackexchange.com/questions/564751/how-can-i-simply-prove-that-the-pearson-correlation-coefficient-is-between-1-an
sir can you suggest a tabelau course for me ? i am confused where to learn from ?.
You are a champ!
Thanks Rohit.
One suggestion can u please make a video for detailed probability for beginners please it a request
Thanks for suggesting, noted.
great explanation
Glad you liked it
how to find standard deviation of x and y..basically that denominator
We no need to compute from scratch, tool will help to do so
Sir what about virtual Interview
Fill the form in the previous video. I will. Share invite.
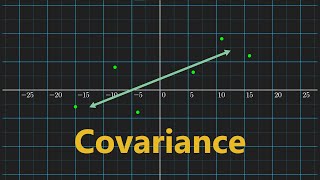
What exactly co variance is
Eexcelent
Thanks Sagar.
Looks like while increasing the value of y you forgot to increase the mean of y
Can you share the link of the data science group so that I can also join
unfold_data_science on instagram
thanksss
kids learn from udemy
legends learn from unfold data science
Thanks Sanyam. your words are always motivating. :)