Hi! Thank you for a great statistic program and wonderful tutorials. One question and one statement: - Why are not two other important assumptions addressed, namely the problem with outliers and the requirement if independence of residuals? - Maybe it should be better illuminated that normality refers to that it is the residuals that should be normally distributed about the predicted dependents variables sore. It can be misunderstood that it is the raw data that should be normally distributed.
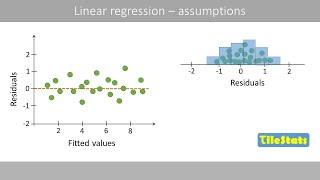
Hi, thanks for the video. Regarding the second assumption (residuals must be normally distributed). Does the histogram represent the normal distribution of the residual, right? I didn't understand if the points in the qqplot are the residuals or the sample data
@@datatab Thanks for the reply. It's very common to see people checking the normality condition on the sample data and not on the residuals. I suppose it's a mistake. Instead, other people say: "Ok, it's not a "real assumption", but it is preferable that features are normally distributed, not only the residuals". Is there any truth behind this statement?
@@retenim28 Hmm normally you main assumption is that the residuals are normally distributed! I can't answer that off the top of my head, but maybe the residuals are always normally distributed if all variables are normally distributed, but I don't know that for sure!
Hmm, I have not read about it yet, but could make sense! Maybe the result is then no longer normally distributed. With it the assumption of independent observations would then be included in the assumption of normally distributed error. Regards Hannah
What do you mean by influential points? Personally, I haven't heard of influential points as a requirement, but I haven't looked that up in more detail either! Regards, Hannah and Mathias
@@datatab By influential point I mean an outlier that greatly affects the slope of the regression line. I was just wondering what the rule of thumb regarding them is when it comes to regression. But fair play if you're not sure if they are part of regression assumptions.
@@Gesuselsaviour Well, if the outliers are too large, then the error epsilon will probably no longer be normally distributed and thus the requirements are not met, but as is so often the case, there is unfortunately no limit value that says from there it still goes and from there no longer!
so wtf do i do if my data isnt linear? just show a graph saying its not linear therefore i havent bothered to run and stats and all these data and research is a waste of time ?
Nope. Then you identify what distribution your dataset is following and try to predict. There are number of other distributions apart from linear. It might be quadratic or logarithmically related.
It should be linear in the --Parameters--, not your data itself. For example, a quadratic y = A + Bx² is still linear. You just need to put x² in your x axis to show that. The parameters in this case are A and B. That's a common misconception not explained in the video. y = A + Bx + Cx² is also linear (it will be a multilinear regression in this case). Even y = A + B cos(x) is linear, but y = A + B cos(Cx) is not linear anymore. C is not linear in relation to y. In general, for a function to be linear for a regression, it should follow y = Af(x) + Bg(x) + Ch(x) +...
Why is it the case that you should square the determinant in order to check for linearity? If there would be a logistic correlation, it would still be significant if you squared the determinant, right? Or not?


If you like, please find our e-Book here: datatab.net/statistics-book 😎
Well explained. Thanks for including the diagnostics, which is by far the most important part and something not often covered in most of the videos.
Glad it was helpful! Regards Hannah
Fantastic explanation. Presentation of the concept is excellent
Presentation of the concept is excellent 👍.
Much appreciated 🎉
Thanks a lot 😊
Hello Ma'am , your teaching technique really Awesome.
Please make a video lecture on
""" What if these Linear Regression Assumption get violated ? """
you can ask chatgpt, can’t you?
Hi! Thank you for a great statistic program and wonderful tutorials.
One question and one statement:
- Why are not two other important assumptions addressed, namely the problem with outliers and the requirement if independence of residuals?
- Maybe it should be better illuminated that normality refers to that it is the residuals that should be normally distributed about the predicted dependents variables sore. It can be misunderstood that it is the raw data that should be normally distributed.
Hello Per, thank you for your feedback! Yes that's right! Maybe we can make a video again to put that better there! Regards Hannah
@@datatab The assumption of independence of errors is actually very important. Your video is misleading people by not covering it.
Wow. Fantastic explanation.
Thank you ma'am for such a simple explanation it really helped me
Glad to hear that! Many thanks! Regards Hannah
Hi, thanks for the video. Regarding the second assumption (residuals must be normally distributed). Does the histogram represent the normal distribution of the residual, right? I didn't understand if the points in the qqplot are the residuals or the sample data
Hello thank you very much! Yes you are right! The captions are not correct, it is the residual in both cases! Regards, Hannah
@@datatab Thanks for the reply. It's very common to see people checking the normality condition on the sample data and not on the residuals. I suppose it's a mistake. Instead, other people say: "Ok, it's not a "real assumption", but it is preferable that features are normally distributed, not only the residuals". Is there any truth behind this statement?
@@retenim28 Hmm normally you main assumption is that the residuals are normally distributed! I can't answer that off the top of my head, but maybe the residuals are always normally distributed if all variables are normally distributed, but I don't know that for sure!
Thanks so much.
Do you have some features open (free) for students (i.e. regression)?
Thanks so much. What about the assumption: independence of the observations?
Hmm, I have not read about it yet, but could make sense! Maybe the result is then no longer normally distributed. With it the assumption of independent observations would then be included in the assumption of normally distributed error. Regards Hannah
Very helpful. Thank you so much.
Thanks for your feedback!!! Cheers Hannah & Mathias
Very nice explanation 😄🙌
Thanks!
Nicely explained!!
Many Thanks : )
Thank you ma'am, helped a lot
Thanks!!!
Thanks for the video, found it very helpful. Do we also have to ensure that there are no influential points in the data?
What do you mean by influential points? Personally, I haven't heard of influential points as a requirement, but I haven't looked that up in more detail either! Regards, Hannah and Mathias
@@datatab By influential point I mean an outlier that greatly affects the slope of the regression line. I was just wondering what the rule of thumb regarding them is when it comes to regression. But fair play if you're not sure if they are part of regression assumptions.
@@Gesuselsaviour Well, if the outliers are too large, then the error epsilon will probably no longer be normally distributed and thus the requirements are not met, but as is so often the case, there is unfortunately no limit value that says from there it still goes and from there no longer!
Good video
Thank you very much!
You are welcome!
Well explained!
Fantastic. Thanks a lot
Thanks for your Feedback!
Thank you ma'am!
Hey! Your videos are awesome! It would be great if you make more videos on Machine Learning concepts.
Many thanks! Yes we will try! Regards Hannah
Marvelous
so wtf do i do if my data isnt linear? just show a graph saying its not linear therefore i havent bothered to run and stats and all these data and research is a waste of time ?
Nope. Then you identify what distribution your dataset is following and try to predict. There are number of other distributions apart from linear. It might be quadratic or logarithmically related.
It should be linear in the --Parameters--, not your data itself. For example, a quadratic y = A + Bx² is still linear. You just need to put x² in your x axis to show that. The parameters in this case are A and B. That's a common misconception not explained in the video. y = A + Bx + Cx² is also linear (it will be a multilinear regression in this case). Even y = A + B cos(x) is linear, but y = A + B cos(Cx) is not linear anymore. C is not linear in relation to y. In general, for a function to be linear for a regression, it should follow y = Af(x) + Bg(x) + Ch(x) +...
Loved your accent
🙂
Thanks u so much
Many thanks for your Feedback!
Regards Hannah and mathias
soooo good! tysm
Some segments in the video are stamped not adjacent to each other
Hello, what do you mean by that?
Why is it the case that you should square the determinant in order to check for linearity? If there would be a logistic correlation, it would still be significant if you squared the determinant, right? Or not?
I'm in love
: )
Kandungan anda sangat menyentuh
Wow! Thank you :-)
Thanks for your Feedback! Regards, Hannah