SPSS Correlation Analysis - Complete Beginnner Guide

ฝัง
- เผยแพร่เมื่อ 24 ส.ค. 2024
- DESCRIPTION:
How to run a correct and complete correlation analysis in SPSS?
In today’s video, I’ll slowly walk you through each step such as
-a quick data screening
-inspecting correlations
-checking assumptions and
-optionally -APA reporting.
I’ll also point out some handy rules of thumb for interpreting correlations and some nice tricks for creating better output.
TIMESTAMPS:
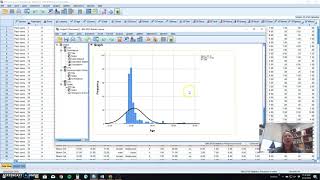
04:28 data screening I - histograms
06:38 exclude outliers & set user missing values
14:28 data screening II - scatterplots
20:21 interpreting correlations
22:06 Cohen's rules of thumb for small, medium and large correlations
25:15 assumptions for Pearson correlations
26:36 p-values for Pearson correlations
30:03 confidence intervals for Pearson correlations
32:25 APA style reporting Pearson correlations
RESOURCES:
Download original data file: www.spss-tutor...
Download finished syntax: www.spss-tutor...
SPSS all scatterplots tool: www.spss-tutor...
SPSS syntax introduction: www.spss-tutor...
FOLLOW US:
Official website: www.spss-tutor...
TH-cam: / @spss-tutorials
LinkedIn: / spss-tutorials
Facebook: / spss.tutorials.website
#spss #statistics


![[LIVE] : ONE ลุมพินี 76 | คู่เอก "ผึ้งหลวง vs สมิงดำ"](http://i.ytimg.com/vi/9SBshmGQOIM/mqdefault.jpg)


A few comments
I wish you would turn on the toolbar in the Syntax Editor. It can help a lot with syntax.
To see patterns in correlations with bunch of variables, it is very helpful to color code the cells based on correlation size. SPSSINC MODIFY TABLES can do that.
For scatters, it is convenient to do a matrix as scatter plot instead of a bunch of bivariate scatters, although you lose some details.
Looking at significance in the correlation matrix, one must be aware of the multiple testing issue.
Hi Jon, thanks for the suggestions!
I'm very interested in your SPSSINC MODIFY TABLES suggestion.
I created a heatmap from a correlation matrix a long time ago (which I found very interesting) but doing so was hard. So an easier solution for this is super welcome.
The matrix scatter is also a good idea for a small number of variables. The tool I used can also add a CURVEFIT for each variable pair and I think that should be a standard routine (but it was too much detail for this simple video).
I hadn't even thought about multiple testing. Is there any easy was to apply Bonferroni(Holm) to Pearson/Spearman correlations in SPSS?
I guess this is easier for the (more recently introduced) CI's as you can choose any confidence level here such as (1 - .05/6) for 4 variables. But that's just Bonferroni...
P.s. I think it's a pity that the latter procedure results in a separate table with a somewhat inconvenient table structure. I'd much rather prefer a standard (square) correlation matrix with CI's in square brackets if requested. IMHO, there's a lot of room for improvement here.
SPSSINC MODIFY TABLES (Utilities > Modify Table Appearance) now has the ability to produce a heatmap effect for any table.
Here's an example for a correlation table. It excludes coloring the diagonal. It's a little bit complicated, but the dialog box can generate all this.
SPSSINC MODIFY TABLES subtype='Correlations'
SELECT="Pearson Correlation" DIMENSION=ROWS LEVEL = -1
/STYLES APPLYTO="x < 1"
HMAUTOCOLOR=YES USEABS=YES HMSCALE=LINEAR.
There is a lot of control over the color range and how it is spread, but HMAUTOCOLOR does a pretty good job
without using those features.
That dialog box now allows the user to use a color picker or enter rgb components for colors, but unfortunately, the color picker
control doesn't remember state on recall due to a bug in the custom dialog builder. If you paste the syntax, though, it pastes
the RGB components, so those can be reused without relying on the color picker control.
For the CI issue, it's hard to jam all that information into a single correlation matrix display, but the STATS CORRELATIONS extension command does give you a way to get a reasonable display with a flexible combination of variables.
image.png
If you want to apply a multiple testing correction, STATS PADJUST can do that. It offers six different types of correction..
Bonferroni might be too conservative for a correlation matrix with more than a few variables, but Benjamini-Hochberg
would usually be a good choice.
There are two versions of matrix scatterplots available - the Chartbuilder GPL (same as the legacy dialog) and Graphboard Template Chooser, which also puts histograms in the diagonal elements.
The Chartbuilder matrix scatterplot can apply a linear fit to each box.@@SPSS-tutorials
@@JonPeck100Hi Jon!
I had another look into STATS CORRELATIONS.
First off, I think it's a pity that it requires a DATASET NAME. I never use (or recommend) using this. It simply gets in my way without being helpful in any way.
Also, the warning may deter SPSS beginners from proceeding with STATS CORRELATIONS if they're unaware that DATASET NAME ... will solve this issue.
Why don't you have Python apply and remove a (random) DATASET NAME if not applied by the user?
Also, I'm not a big fan of the resulting table layout and the inability to choose which statistics I want to see. Why not have users select r / N / p / CI as they see fit?
Finally, as a more general point, I think many extensions are quite inconsistent regarding their naming/titles. I only learned that STATS CORRELATIONS is the same extension as "Bivariate with..." because I stumbled upon some .pdf document with a couple of screenshots.
Note that these 2 names literally don't have a single word in common.