Thank you for the clear summary! I just have one small question about your blog the barplot for the function "plot_xtab" had frames, I can't find an argument on the package guide for that? am I missing something?
the design of plots can be changed with themes from ggplot. so, no argument inside of plot_xtab is needed. Here is an example: plot_xtab( x = Wage$education, grp = Wage$jobclass, margin = "row", bar.pos = "stack", show.summary = TRUE, coord.flip = TRUE) + theme_blank() try our other theme too, like theme_bw() etc. Thanks for positive feedback! :)
glad to hear that, mate! if you want to blow your's teachers minds with your bachelor thesis, check out my review on {gtsummary} package and use the code
Thanks Julian! Don't worry about random effect in this particular example, it was meant to clarify the effect of wage end jobclass on age ... (because random effects takes out some unwanted variance in the data), but I guess it only produced more questions. Again, forget about it in this example. But I plan to cover mixed effects models in the future. However, if you wanna dive into it earlier, I can recommend a very good book for it "Mixed Effects Models and Extensions in Ecology with R". cheers
@@yuzaR-Data-Science Thanks Yury... one questions that's popped up for me, in binge-ing through your videos is "what happens when the data doesn't meet the assumptions required for linear regression?" Like, I know that sometimes there can be some transformations used to get certain variables better situated for this type of modelling... and other instances where alternative modelling types have to be used (I'd be interested in what the differences would be between runnign the original linear regression -even though the data fails the assumptions -vs the results of running the alternative model(s). Anyway, totally no pressure, just an idea for a future video 🙂
Hey Julian, that's a great idea, I actually did such comparison in several videos already. For instance, robust and quantile regressions (even 2 videos there). So, feel free to check them out. But there is no general rule what to do, because even when you log-transform data, it does not always solve the non-normality or heteroskedasticity. But yeah, QR often helps.
hi loved your videos , do you have any video on time series analysis. i need to explore impact air pollution on lung function over 10 years of period data.
@@yuzaR-Data-Science thanks do you know roughly when it will done. also i email the data and rcode for show specific terms both from count and zero inflated model in plot_model.
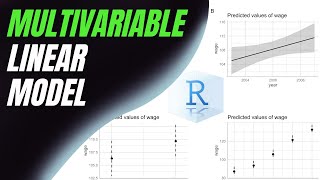
I understand that for the estimates plot (default plot_model), the bar means the 95% confidence interval. But for the predictions ( plot_model(type = "pred") ), what does the bar mean? Is the dot the average prediction for that category, and the bar the standard deviation? Also, if a model includes several predictors (y = a + b + c), showing the prediction plot of one of them (a) corrects for the effects of the others, right? Amazing video, made with a very good explanation and a lot of work on the visuals too!
Both bars show 95% CIs by default. You can learn more by asking R about it: "?plot_model". And yes, the model "corrects" for other predictors, or, as I like to think about it, it calculates what we want when other predictors are stable (usually at average). Thanks a lot for a feedback and thanks for watching! Cheers
Hi thanks nice video. I need help in Plot_model for zero inflated negative binomial regression. I need to to specific terms both from count and zero inflated model. I can share part of data and code. How can I send you
Hi, thank for the feedback. You just need to use the "show.zeroinf = TRUE" argument. Here is an exapmle: require(ggplot2) require(pscl) require(boot) zinb
You can determine the width and the length of the plot in every particular r markdown chunk and save the pic with any dimensions. Hope that helps. Cheers
@@yuzaR-Data-Science Thanks for the reply. I have been using Quarto lately and thought that it at the capability of resizing images and tables as a feature. Perhaps I am wrong.
@@haraldurkarlsson1147 Hey, waw, never heard of quatro. Will check it out. Yes, you can change size of the image easily in rmarkdown. Found a link for it: bookdown.org/yihui/rmarkdown-cookbook/figure-size.html
@@yuzaR-Data-Science Quarto is the next step in the evolution of reproducible reports. It is like RMarkdown but actually a standalone product. I have been trying out for a couple of weeks and it is quite impressive.


Thank you, this helped me so much! All the demonstrations. I learnt way more than I came for.
You are so welcome! Glad it was useful! Thanks you for watching!
Man wow! thank you you are a really good teacher!
Thanks a lot, Aziz! Very nice of you! Thanks for watching!
Thank you for the clear summary! I just have one small question about your blog the barplot for the function "plot_xtab" had frames, I can't find an argument on the package guide for that? am I missing something?
the design of plots can be changed with themes from ggplot. so, no argument inside of plot_xtab is needed. Here is an example:
plot_xtab(
x = Wage$education,
grp = Wage$jobclass,
margin = "row",
bar.pos = "stack",
show.summary = TRUE,
coord.flip = TRUE) +
theme_blank()
try our other theme too, like theme_bw() etc.
Thanks for positive feedback! :)
Best R videos in youtube 👏🏻👏🏻👏🏻
Thanks 🙏 soo much ! That motivates to produce more :) so, more to come soon!
Barely leave a comment, but you are really an amazing teacher!
So nice of you! Thanks 🙏
An amazing explanation with an amazing voice! Best combination ever!
Wow, thank you! Glad you enjoyed it!
Holy shit, i think you just saved my bachelors thesis
glad to hear that, mate! if you want to blow your's teachers minds with your bachelor thesis, check out my review on {gtsummary} package and use the code
I can’t express my appreciation for these tutorials.. A mini Jesus
Thousand thanks 🙏
What an amazing illustration. Many thanks!!!!
You are very welcome!
🥰🥰🥰, i did know, but thanks for refresh, plus new updates 👍🏻👍🏻
Glad it’s useful!
Excellent, thank you so much. You are very great teacher i have never seen.
Wow, thank you, Saygin!
Excellent work, thanks so much sir
Sir we need a machine learning tutorial using Caret package
Thanks 🙏 I am planning something even better than Caret ... tidymodels ... it builds on Caret. So, stay tuned
What a great idea, reviewing packages. Amazing work, thank you. 😊
Thanks a lot! I plan to do more. Stay tuned 😉
Nice
Thanks!
Ahoy Yury (lovin' all you videos lately), at 6:28 you mention a "random effects of education" term. Can you explain what this is a bit more?
Thanks Julian! Don't worry about random effect in this particular example, it was meant to clarify the effect of wage end jobclass on age ... (because random effects takes out some unwanted variance in the data), but I guess it only produced more questions. Again, forget about it in this example. But I plan to cover mixed effects models in the future. However, if you wanna dive into it earlier, I can recommend a very good book for it "Mixed Effects Models and Extensions in Ecology with R". cheers
@@yuzaR-Data-Science Thanks Yury... one questions that's popped up for me, in binge-ing through your videos is "what happens when the data doesn't meet the assumptions required for linear regression?" Like, I know that sometimes there can be some transformations used to get certain variables better situated for this type of modelling... and other instances where alternative modelling types have to be used (I'd be interested in what the differences would be between runnign the original linear regression -even though the data fails the assumptions -vs the results of running the alternative model(s). Anyway, totally no pressure, just an idea for a future video 🙂
Hey Julian, that's a great idea, I actually did such comparison in several videos already. For instance, robust and quantile regressions (even 2 videos there). So, feel free to check them out. But there is no general rule what to do, because even when you log-transform data, it does not always solve the non-normality or heteroskedasticity. But yeah, QR often helps.
Always on point. Thanks sir for the work.
You are very welcome Jonathan! Glad you liked it.
Thank you for taking the effort to show this great 📦. By the way, what software do you use to make these beautiful screencasts?
You're welcome 😊 For the video editing I use final cut pro
hi loved your videos , do you have any video on time series analysis. i need to explore impact air pollution on lung function over 10 years of period data.
Hi, thanks 🙏 not yet, but I plan the topic in the future
@@yuzaR-Data-Science thanks do you know roughly when it will done. also i email the data and rcode for show specific terms both from count and zero inflated model in plot_model.
Thank you so much. This is great.
You're very welcome! Glad it was helpful!
@@yuzaR-Data-Science Very helpful. I was wondering if you can also create tutorials on geospatial data analysis using R.
I understand that for the estimates plot (default plot_model), the bar means the 95% confidence interval. But for the predictions ( plot_model(type = "pred") ), what does the bar mean? Is the dot the average prediction for that category, and the bar the standard deviation? Also, if a model includes several predictors (y = a + b + c), showing the prediction plot of one of them (a) corrects for the effects of the others, right?
Amazing video, made with a very good explanation and a lot of work on the visuals too!
Both bars show 95% CIs by default. You can learn more by asking R about it: "?plot_model". And yes, the model "corrects" for other predictors, or, as I like to think about it, it calculates what we want when other predictors are stable (usually at average).
Thanks a lot for a feedback and thanks for watching! Cheers
@@yuzaR-Data-Science Thanks for your fast and accurate response!
@@Reonsi you are very welcome!
Thank you for the tutorial
You are welcome 🙏
Very clear
Thanks 🙏
Hi thanks nice video. I need help in Plot_model for zero inflated negative binomial regression. I need to to specific terms both from count and zero inflated model. I can share part of data and code. How can I send you
Hi, thank for the feedback. You just need to use the "show.zeroinf = TRUE" argument. Here is an exapmle:
require(ggplot2)
require(pscl)
require(boot)
zinb
Wow great teacher
Thanks 🙏
Sir is it possible to merge frequency and percentage in single column in cross tab table in sjPlot like n(%) as in gtsummary package
you could force it using dplyr, but I would just decide which one, gtsummary of sjPlot I want and take that one. Both are great!
Thank you.....
You're welcome! Thanks for watching!
The factet barplots are crowded. Although that is fixed in an expanded plot in a script file it does not scale in an RMarkdown or Quarto file.
You can determine the width and the length of the plot in every particular r markdown chunk and save the pic with any dimensions. Hope that helps. Cheers
@@yuzaR-Data-Science
Thanks for the reply. I have been using Quarto lately and thought that it at the capability of resizing images and tables as a feature. Perhaps I am wrong.
@@haraldurkarlsson1147 Hey, waw, never heard of quatro. Will check it out. Yes, you can change size of the image easily in rmarkdown. Found a link for it: bookdown.org/yihui/rmarkdown-cookbook/figure-size.html
@@yuzaR-Data-Science Quarto is the next step in the evolution of reproducible reports. It is like RMarkdown but actually a standalone product. I have been trying out for a couple of weeks and it is quite impressive.
@@haraldurkarlsson1147 thanks mate! I'll definitely check it out!
huuuu, great.... thanks
Welcome