Resistance, Mean, Median, 5 Number Summary and BoxPlots

ฝัง
- เผยแพร่เมื่อ 18 ต.ค. 2024
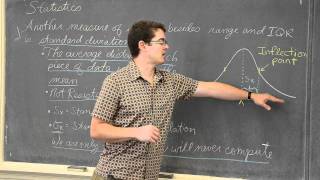
- I start going over 5 number summary of distributions, define resistance, and box plots.
Check out www.ProfRobBob.com, there you will find my lessons organized by class/subject and then by topics within each class. Find free review test, useful notes and more at www.mathplane.com If you'd like to make a donation to support my efforts look for the "Tip the Teacher" button on my channel's homepage / profrobbob


I'm so glad you have Statistics! I used your videos for Algebra, Algebra 2, and now Stats! Thanks to you, math doesn't seem as terrifying anymore. A sincere Thank You, Mr. Tarrou (:
You're welcome and sincere appreciation from me to you Makoto Ritsuka for watching, learning and supporting my channel by subbing too! I'm happy to hear that I have helped take the fear out of math and hope you even find it to be "Fun" sometimes too:D I too hope this means you are telling all your friends, class and teachers to watch and SUBSCRIBE and keep sharing...BAM!!!
The wonderfully clear way by which you relay your knowledge is immensely helpful and the positive impact / motivation your videos produce feels priceless, and cannot be said enough.
Thank you for doing soo much!!
I felt like only saying ‘thank you’ wouldn’t quite cut it ^_^
BAM!
You're welcome...It's always nice to hear that my teaching style is appreciated! Thanks for the compliments and please continue to share this free resource with everyone...BAM!!!
I just want to say that if not for your videos I would have really struggled in my precalc and trig classes. Thanks to you I passed both of those classes and now I'm taking Stats I and I have my first exam today and I feel like I will do well. Just by uploading these videos you have helped so many people. Thank YOU so much!
Thanks for taking the time to "Thank the teacher" and to share your success story with me Sabrina Slimane and for choosing #ProfRobbob to learn from, sub to and keep coming back to learn for each new subject...those great study habits will take you far! Thanks for the support and I hope you continue to share my channel with every new friend, classmate and teacher while reminding them to like, subscribe and support the ads to help these free educational channels grow and remain free:D
@Angeliniwini Thanks for the positive feedback. I really appreciate it:) My book does not have the concept of extreme outliers. It sounds like you do Q3+3(IQR) for the upper bound and Q1-3(IQR) for the lower bound. I will look it up tomorrow and get back to you. Keep up the good work!
I wish I knew you taught Stats; otherwise, I would have watched your videos when I had the class the first semester. I am glad I saw your channel for Statistics as I can easily prepare for the AP exam with your assistance as well as my prep books.
Thank you so much :)
Parnika Kapur you're welcome and thanks for choosing my channel to help you with that studying and I wish for you a 5 on that AP exam...BAM!!!
@mypostedtestvideo321 ...approximately normal even if the population is not. Box-plots just show shape...Correlation measures strength and direction of a linear relationship...t-tests are a test for when you are working with averages and you are working with the sample standard deviation.
"Scary looking Greek symbol" - I like your humor. :D I've learned some useful things in this video including that the mean is the closest to the tail of a skewed distribution. :)
I've been working on that:)
Thanks for tuning into my channel LeBadman and there are plenty more so go ahead and SUBSCRIBE!
LeBadmap
I am so excited to see you do Statistics videos, too! I watched your videos all through Pre Calculus, and I love your style of teaching! Thank you!!
You're welcome Jennifer Allen and I'm also excited that I will get to help teach you even more math:)
Thanks for choosing my channel and subbing...and please don't forget to keep spreading the word to help us keep growing:D
Watching your videos to study last minute for the AP exam tomorrow - such a big help!
@Evousa Thank you very much. I am really enjoying making these videos this year. There will be many more to follow.
Thank you so much for making all of your videos. They are so helpful and clear! I was so confused about a lot of the statistics information on my upcoming test and your videos really clarified a lot for me. So thank you very much.
Is there any possibility you could please do a video on frequency tables? (about marginal frequencies for two way tables, two-way contingency tables, and conditional relative frequencies and association) ? It would be so greatly appreciated!
Thanks again Professor!
Thanks. The necklace and then the pendent were 2 seperate gifts:)
@mypostedtestvideo321 I have only taught statistics from three editions of the same book over the years of teaching AP Statistics...and it does not use the vocabulary of parametric statistic test. So I don't really know how to answer your question. Anova is also not language used in my book. I will say the only thing that I teach that allows you to work around non-normality is the Central Limit Theorem...which states that with a large enough sample the distribution of averages will be...
You are an amazing teacher! Simplifying what many complicate! You make math enjoyable, as it should be! Kudos to you Sir! :)
THANK YOU Niki Fayaz for that awesome compliment and for choosing #ProfRobBob to learn from!
Please continue to share your experience and my channel with others and remind them to support by liking, subbing, supporting the ads, sharing thru social media and with friends, classmates and teachers too:D
subscribed to your channel! I wish I discovered them earlier. Will definitely recommend to my friends, thank you!
You're welcome...better late than never we used to say:)
Thanks for subbing and sharing...because that's how we keep growing!
@Starr169 Thanks.
Hey, I am a student in India and my school doesn't offer any ap classes. If I watch your entire series will I be able to score a 5 in AP Stats.
Thank you prof. Rob, the videos are amazing though.
Thanks from this Florida teacher for watching and learning from this channel...BAM!!!
That was the intention when I made these for my AP Stats class!
Search AP Statistics FRQ's for their old free response questions. Finding multiple choice review problems is a little harder to find so you may have to buy a review book....but it should be doable:)
Pay special attention to how they word the conditions checks and summaries now verses the wording in some of my videos.
I like the quality of this video
First thx for all the great work u are doing but i am wondering about which book you are talking? Thx :)
THANK YOU for watching and subscribing and I teach from "The Practice of Statistics 3rd addition"
Very nice bro. Good explanation A++++
Dear Prof Rob, I'm a new stats teacher. My book asks the students to consider if events are independent based on the numbers in a marginal distribution chart. One example was looking at the people who died on the titanic. We thought that if the relative frequencies were different, the data was independent. the author of the text said that was wrong. Because the percentages were different there was some interaction or a hidden influence that we couldn't see. Well, we all don't get it. Can you shed some light on this apparent backwards thinking?
My stats book has some very uplifting problems like yours as well. There are two checks for independence. p(A)*p(B)=p(A and B) or p(A)=p(A|B). The second statement the probability of a is equal to the probability of a given b that has already occurred. If event B occurring changes the probability of A occurring, then B has effected event A. If A is earning a passing grade on a test and B is studying for that test, we as teachers would hope that the P(A|B) would be greater than P(A). Your grade depends on whether or not you studied. If p(A)=p(A|B), then studying and test grades are independent... studying did not influence your grade so why study! I hope this makes sense. This lesson may help too, th-cam.com/video/Odrxd0OmamM/w-d-xo.html All of my Stats lessons are here, www.profrobbob.com/ap-statistics My first year teaching this course was rough!!! Glad I can help a little bit:)
if i have non-normal data, which one of the below that i am able to use to perform a parametric statistic test?
a) anova
b) box-plots
c) Correlation
d) paired t-test of coefficients
please help me!!! Thanks!!!
Prof Rob bob you didn’t jump to the front of the board in the beginning?? 😮
This was one of my early videos before I started the bam jump...good to see you were paying attention though:)
@linday1ful Thank you! I hope you do great in your class. Please spread the word about my new math channel I am building:)
Can you be more specific with "Non-Normal" data?? Thanks!
I think it means data with outliers
hello professor,Suppose we made 7 trips in day and calculated the mean value from given dataset of 7 trips, after the eighth trip of the day, the mean distance traveled remains unchanged. What is the distance of the eighth trip? and what about standard deviation of distance ,When we add the eighth trip to the data set, Does it increase, decrease or stay the same?
+Mehak Kahlon If the distance of day 8th did not change the mean distance which includes the previous 7 days, then the 8th day distance must have been equal to the mean of the previous 7. Since standard deviation is the average distance each piece of data is from the mean, adding a piece of data that is equal to the mean is adding a piece of data that is 0 units from the mean. This is going to lower the standard deviation.
+ProfRobBob why is it equal to the mean of the previous 7?
+Amy Irene say for example 5,6,7,8,9,12,13 seven trips if you add 1 more trip first you cal mean of these 7 numbers 60/7=8.571 is the mean
for cal distance for 8th day trip you can use this formulamultiple 8.5x7+X=8.5x8,,,,,,x+59.5=68,,,,,,,,x=8.5 for the 8th day trip as it is equal to mean of the previous value
n will increase then standard deviation will decrease
+ProfRobBob thank you i understood this concept very well
+Mehak Kahlon thanks for studying:)
what textbook do you use for your AP stat class?
"The Practice of Statistics" 3rd Edition.
Thanks for watching and subbing!