Hey very nice breakdown, hard to follow your accent at times, but your video is well done and nicely organized. I'm an experienced private tutor and I'm interested in finding new students who are taking ODE and PDE for upper division math. I usually only help students with math from algebra to calculus to ODE (which is lower level), but I'd like to add some upper level course work to my list of skills. The class begins with linear systems of ODEs and ends with nonlinear systems. Of course they'll end up studying phase portraits to give qualitative descriptions of nonlinear systems and their stability. Overall, your video really helps because reading my textbook is great, but there may be 3 or 4 solid examples without much variety throughout an entire 5 to 8 sections (Like whaaa?).
That's a good question because there are systems where there is a repeated eigenvalue that will still produce 2 linearly independent eigenvectors. In one of my university textbooks there's one example but its with a 3x3 system (what the heck, right?). You can understand it similar to how you look at a 2x2 however the eigenvectors < x, y, z > or < x1, x2, x3 > will be plotted in R3 starting at the origin and ending at the point in R3, and I assume these are surface trajectories (or parametric surfaces in R3) instead of curve trajectories (or parametric curves in R2). I'll be back if I find a 2x2 example :)
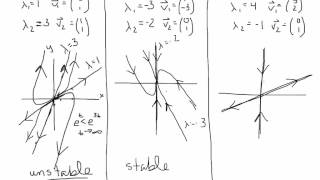
I found it! It turns out that when we have repeated eigenvalues and are able to find 2 linearly independent eigenvectors, we get a proper node also called a star point. The trajectories turn out to all be straight lines coming out of the origin (equilibrium point). This is why its called a star point (more like an asterisk *). The direction of the trajectories is either toward the origin or away depending on the eigenvalues being positive or negative. Last thing, they say that the ratio of x2 and x1 (which are the solutions for x(t) and y(t), the whole subscript notation makes it harder to understand), is only dependent on c1, c2, eigenvector 1 and eigenvector 2 - since these are constant it means that the ratio y/x or x2/x1 will be constant (a constant slope) and that gives linear trajectories.


This lecture helped me a lot ma'am. Thanks a lot.
very clear and fluent!!
highly recommend to watch this tutorial!
Hey very nice breakdown, hard to follow your accent at times, but your video is well done and nicely organized. I'm an experienced private tutor and I'm interested in finding new students who are taking ODE and PDE for upper division math. I usually only help students with math from algebra to calculus to ODE (which is lower level), but I'd like to add some upper level course work to my list of skills. The class begins with linear systems of ODEs and ends with nonlinear systems. Of course they'll end up studying phase portraits to give qualitative descriptions of nonlinear systems and their stability. Overall, your video really helps because reading my textbook is great, but there may be 3 or 4 solid examples without much variety throughout an entire 5 to 8 sections (Like whaaa?).
Good and clear video
Very helpful ma'am. Thank you.
Very good video! Thanks so much!
thx
Amazing!!
Thank you miss 💜
Good explanation. What if we have real, repeated eigen values with two linearly independent vectors.
then you die
That's a good question because there are systems where there is a repeated eigenvalue that will still produce 2 linearly independent eigenvectors. In one of my university textbooks there's one example but its with a 3x3 system (what the heck, right?). You can understand it similar to how you look at a 2x2 however the eigenvectors < x, y, z > or < x1, x2, x3 > will be plotted in R3 starting at the origin and ending at the point in R3, and I assume these are surface trajectories (or parametric surfaces in R3) instead of curve trajectories (or parametric curves in R2). I'll be back if I find a 2x2 example :)
I found it! It turns out that when we have repeated eigenvalues and are able to find 2 linearly independent eigenvectors, we get a proper node also called a star point. The trajectories turn out to all be straight lines coming out of the origin (equilibrium point). This is why its called a star point (more like an asterisk *). The direction of the trajectories is either toward the origin or away depending on the eigenvalues being positive or negative. Last thing, they say that the ratio of x2 and x1 (which are the solutions for x(t) and y(t), the whole subscript notation makes it harder to understand), is only dependent on c1, c2, eigenvector 1 and eigenvector 2 - since these are constant it means that the ratio y/x or x2/x1 will be constant (a constant slope) and that gives linear trajectories.