Mannnn! I was just banging my head against the wall reading " The Definitive Guide to Tax." But now, having watched this, I wanna go and explain it to everyone. Great clarification. Looking forward to Context transition and the bastard invisible Calculate in measures and dependencies.
Notes for revision. 13:03 Filter context is automatically propagated from a table to another, following the relationship. Arrow of relationship indicates propagation of filter context. Filterable (broken down) based on related table: filtering the Product, Customer and Dates table. --- *Filter,**Measure,**Calculate* First, we define a measure: Sales Amt = SUMX( Sales, Sales[qty] * Sales[price] ) Then use the measure in calculate, that can include filters. CALCULATE ( [Sale Amt], Customer [continent]="Europe") Here, Sales table, included in [Sale Amt], will first be filtered by whatever in the visual filter. Then, the additonal filter in this calculate i.e. Customer [continent]="Europe") is applied to the table. Only then SUMX run its expression (row by row).
Thank you sir , I’ve been developing SSAS tabular cube and recently Power BI, I never throughly understand DAX language, all my development in the past involve tons of google and try and error.. I really appreciate this series of tutorial you put out, I’m re-learning the fundamental and syntax start to make sense !
Thank you for sharing, really great idea to build the understanding layer by layer: *Row Context *Filter Context *CALCULATE Function *Context Transition
Ciao Alberto, and Fellow Viewers, A question please. There was no relationship between Sales table and Customer table. The relationship was added only later, at 12:41. How did the filter *Customer[Continent]="Europe"* in [Europe Sales] work without that relationship? Please enlighten me. Thanks.
Notice that the model view has two tabs. The relationship between Customer and Sales was most likely alreday established on the All tables tab. The Layout 1 tab was only showing a subset of the tables in the model.
Thanks for nice video. Really helpful. I have a question & problem. Would be great if you can explain how to do that.. Question ; I have an excel table for projects, about 100.000 rows for each project, with 10 columns that specifies the project specs. Question is ; In Power BI, i would like to choose one project then i would like to find most similar projects from main excel table according to similarity based on column data (each column will have weighted similarity factor & column context can be number & text). And then list them based on more similar project to less similar project by similarity score.
Thank you for your explanations, I read these concepts over and over again in your book, many times I clarify doubts, but others arise. On this occasion I want to ask you about the use of measures as variables within another measure. I have done some tests and to correct the values of the totals, if I use the measure that works row by row and then call it within another measure with SUMX or AVERAGEX, it corrects the error, but if I use the measure by assigning it to a variable it doesn't work for me. works. Could you explain to me what the effect is and why the difference?
Sir, I am having the data of sales amount having the column State and District. I have created a measure for total sales. and created 2 Slicer i.e. State and District and I have sync slicer for all the pages of the report. I have created a table with column State and Sale. If I don't selected any slicer from state then default value should be State Column and Sale Column and If I select any state the respective district of the state should come i.e. District column in place of State Column and Sale column. Please advise sir, how it can be done.


The step by step and zooming in are fantastic. Much better to go slow, but thoroughly.
Mannnn! I was just banging my head against the wall reading " The Definitive Guide to Tax." But now, having watched this, I wanna go and explain it to everyone. Great clarification. Looking forward to Context transition and the bastard invisible Calculate in measures and dependencies.
same here!
Excellent. I went straight to my dashboard and grabbed the code, it's much easier to understand after following your courses.
Notes for revision.
13:03
Filter context is automatically propagated from a table to another,
following the relationship.
Arrow of relationship indicates propagation of filter context.
Filterable (broken down) based on related table:
filtering the Product, Customer and Dates table.
---
*Filter,**Measure,**Calculate*
First, we define a measure:
Sales Amt =
SUMX( Sales,
Sales[qty] * Sales[price] )
Then use the measure in calculate, that can include filters.
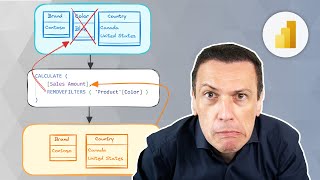
CALCULATE (
[Sale Amt],
Customer [continent]="Europe")
Here, Sales table, included in [Sale Amt], will first be filtered by whatever in the visual filter.
Then, the additonal filter in this calculate i.e. Customer [continent]="Europe") is applied to the table.
Only then SUMX run its expression (row by row).
Ye, this is the best DAX channel without a doubt! Ty Mr. Ferrari!
Thank you sir , I’ve been developing SSAS tabular cube and recently Power BI, I never throughly understand DAX language, all my development in the past involve tons of google and try and error.. I really appreciate this series of tutorial you put out, I’m re-learning the fundamental and syntax start to make sense !
Excellent explantaion about Filter Context which is one of the key fundamental concepts in DAX. Thanks Alberto
Excellent video, simple and straight to the point, taking into consideration all the relevant related topics
Really awesome material on DAX. From DAX example to Row Context, Now filter context. I assume the next video will be on Context Transition.😄😁
Awesome explanation and discussion! Really helps to hear your description along with the examples. Many thanks. Thumbs up!!
Thanks for your dedication and enthusiasm. Brilliant Video and Learning paths - row then filter then calculate and then context transition. bravo
And congratulations on your coming 50K subscribers.
Thanks! A short video about that is coming soon... :)
literally got job based on these videos, thank you very much mr. Alberto
Thanks!, loved the way details about filter context are covered!
Excellent material. Very clear and informative
more nourishing DAX goodness from SQLBI!
This content is pure gold
Thanks a lot!
Thank you for sharing, really great idea to build the understanding layer by layer:
*Row Context
*Filter Context
*CALCULATE Function
*Context Transition
Great job! I think “Row” context is better thought of as “Record” context.
I like your teaching style :)
Great video👍 thanks Mr Alberto.
Grazie!!! bravissimo, chiaro come sempre!!!
Another great explanation!!
Very nice explanation!
Thank you Alberto, excellent.
Thanks for such an informative video.
Ciao Alberto, and Fellow Viewers,
A question please. There was no relationship between Sales table and Customer table. The relationship was added only later, at 12:41. How did the filter *Customer[Continent]="Europe"* in [Europe Sales] work without that relationship? Please enlighten me. Thanks.
Notice that the model view has two tabs. The relationship between Customer and Sales was most likely alreday established on the All tables tab. The Layout 1 tab was only showing a subset of the tables in the model.
great explanation Alberto !
Thanks for nice video. Really helpful.
I have a question & problem. Would be great if you can explain how to do that..
Question ;
I have an excel table for projects, about 100.000 rows for each project, with 10 columns that specifies the project specs. Question is ; In Power BI, i would like to choose one project then i would like to find most similar projects from main excel table according to similarity based on column data (each column will have weighted similarity factor & column context can be number & text).
And then list them based on more similar project to less similar project by similarity score.
Thank you for your explanations, I read these concepts over and over again in your book, many times I clarify doubts, but others arise. On this occasion I want to ask you about the use of measures as variables within another measure. I have done some tests and to correct the values of the totals, if I use the measure that works row by row and then call it within another measure with SUMX or AVERAGEX, it corrects the error, but if I use the measure by assigning it to a variable it doesn't work for me. works. Could you explain to me what the effect is and why the difference?
A variable is a constant, once assigned its value doesn't change. See www.sqlbi.com/articles/variables-in-dax/
Very helpful, keep it up!
Great video!
Thanks Maestro!
Sir, I am having the data of sales amount having the column State and District. I have created a measure for total sales. and created 2 Slicer i.e. State and District and I have sync slicer for all the pages of the report. I have created a table with column State and Sale. If I don't selected any slicer from state then default value should be State Column and Sale Column and If I select any state the respective district of the state should come i.e. District column in place of State Column and Sale column.
Please advise sir, how it can be done.
Perfect, thank you!
Thanks a lot!
Hi Alberto, could it be said, that filter context concerns only Report Mode and visualisations in PBI?
Hey are u related to Ferrari? Jokes aside ur videos are wonderful Please make DAX videos on all concepts Thank u
Thank you
Perfect
where is the context transition video?
Coming mid-May.
boss of dax
古德古德