Create Infographics WITHOUT Custom Visuals in Power BI ✨| Create Dynamic visuals with SVG and DAX ⚡

ฝัง
- เผยแพร่เมื่อ 11 พ.ค. 2023
- In This Video
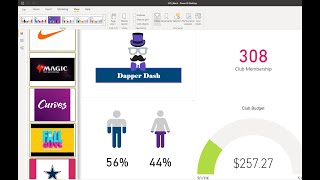
Many times you need to create infographics and you may not be allowed to use custom visuals in your organizations. Here you will learn, how to create such amazing visuals without using any custom visuals in Power BI.
We will use the Power of DAX and SVG codes to create a visual which will represent percentage of total sales by gender.
Get Help into Questions Related to #powerbi , #dax , #powerquery Power BI #datamodeling , #analysisservices and #powerbiservice
Check out our website www.powerbihelpline.com and blog-post. for end-to-end power BI solutions, Power BI templates, or any kind of Power BI questions like Power query errors, Authoring and optimizing DAX codes for complex business logic.
Follow us on LinkedIn
/ power-bi-helpline-22a2...
Email- info@pbihelpline.com
@PowerBIHelpline - วิทยาศาสตร์และเทคโนโลยี


![[TH] VCT Pacific Stage 2 - Playoffs Grand Final // GEN vs DRX](http://i.ytimg.com/vi/Su6gA_UPs9s/mqdefault.jpg)
![[TH] 2024 PMWC x EWC Group Stage Day 2 | PUBG MOBILE WORLD CUP x ESPORTS WORLD CUP](http://i.ytimg.com/vi/vwIQyCmNIBU/mqdefault.jpg)


Outstanding video, as always usefull 😊
Thanks Edwin
Thank you very much ,I was searching same.
Glad I could help
Great video but you are very fast 😅 or I am getting old and slow..
Thanks a lot for sharing.
Thanks for watching. Fast but not furious😅
This is amazing. Thank you for this.
How can you make the background transparent?
for transparent color you can use #FFFFFF00
can you provide the dataset for practice
To get the PBIX file used in the Demo, send an email to info@pbihelpline.com by mentioning the video title as subject name.
Wow... this is amazing. Where do i start to learn to use svg?
Basic HTML will do the job. I believe that, heavy SVG codes will slow down the performance of your report/visuals
ProgBar visual gives automatically gives this, we don't have to create it
As mentioned this is not a custom visual, and it is a way to show , how can we create such visuals with the help of DAX and SVG
Hello. I emailed you. THank you
Let me check
This will take time for me 😂
Most of the codes will be similar, and you can create many amazing things with this.
It doesn't wort to me 🥲
If you want to have a look into PBIX file used in the demo, you can send us an email, by mentioning the video title as email subject. This may help you to verify if you are missing something in the solution.