The place where you link Probability with Statistics is really good.. It's really helpful to make a picture about the things you deal with in your daily work.
I love your way of introducing concepts. I am a Comp Sci. student currently getting into medicine and those videos are insanely helpful. Looking forward to your more advanced videos
This was great! Having done some self-study on statistics in the past year, these videos are great for re-stimulating all the connections and also seeing some familiar concepts in a new light.
I just took a stats course in my Data Science Masters, and this video was a perfect summation of it. We also used R to visualize the distributions, albeit we didn't use ggplot (which looks nicer and is better IMO). Great job!
To complement your discussion on probability vs statistics, one can think of Probability as knowing the data generating process and studying the properties of the data generated by it, and of Statistics as knowing the data and studying the properties of the data generating process that could have generated it
I think “T” is used because it stands for “Test Statistic”. That is, the reason we’d be interested in a statistic is because of its distribution which would be related to figuring out how interesting the value of it is under our distributional assumptions. That, or it stands for the “t” in statistics since “s” is already used for standard deviation and sometimes sum.
In 5:21 I believe there is an error. A Probability distribution actually has a formal definition (see e.g. en.wikipedia.org/wiki/Probability_distribution#Kolmogorov_definition). It has to be a Probability Measure, implying that the function's domain is [0,1], (also its codomain is a sigma-algebra, so each input is a set...) and the result is a probability. If you plug in half-open intervals (-∞, x] to a probability distribution, you get the cdf. This distinction is actually important because there are discrete RVs, which have a probability mass function (pmf), and continuous RVs, which have a probability density function (pdf), but - and this is where it is relevant - there are also mixed RVs, that are described by neither. This is a pain to deal with if you want to write a general form for anything - for instance an expected value. Still, with a little measure theory (and I mean really little, I hardly know any of it myself...) it is possible to generalise...
Yeah you’re right, I tried to simplify it to avoid dipping into measure theory. Thankfully we don’t have to deal with many mixed distributions in more everyday statistics, so it doesn’t come up a lot
Just a quick note, on 4:27 you said that all random variables have a pdf, but that is not always true. The easiest example is a cdf which is not differentiable, then the pdf can not exist. Much more complicated examples can be constructed, but the previous is a quick one.
Thanks for the correction. I should have added a qualifier that it’s random variables that we usually deal with in basic statistical models, but you’re right
Nice video and example. On the r example part I have one question though. Why did you use "runif(2, min=1, max=6) %>% ceiling", it will never give 2 or 3 as a result because it rounds up. Wouldn't "runif(2, min=0, max=6) %>% ceiling" be better for the double dice roll.
Yeah I was supposed to use floor here, but accidentally used ceiling. The triangle distribution is shifted by one but I hope the point still goes across. Thanks for watching!
Hello, I admire your enthusiasm and effort trying to make stats more approchable! Thanks :) My 2 cents, I'm half way and learning a few things but how you are saying CDF and PDF too much while running somekind of powerpoint presentation with animations... I just want to say I personally find it distracting. I see you do have github with R code! I would rather have you talk me through this code in jupyter notebooks and spend more time makign those notebooks more accessible and use their ability to plot etc.. You could still thrown in memes and humour and stuff but I would keep the notebook in focus and always refer to it. Maybe it's just me! I don't mean to tell you how to do your thing heh I just find that it is the kind of learning that I need. Cheers!
Thanks for the input, I appreciate it! Talking through code is something I’m still trying to figure out, so I’ll keep your suggestion in mind as I plan future videos
@@very-normal To give another input with a different opinion, I think your strenght is really visualzations and explaining the intuition behind concepts in a very clear and understandabe way (although it is true that in this specific video I also had some difficulty following when you repeaded PDF, PMF, CDF many times in a few seconds ahah) I think there are already too many videos on youtube on code, and what I really appreciate about this channel is the way you can convey with simplicity the intuition behind concepts, code doesn't allow this and there are only a few youtube channels that do it well. The whole concept of the video would be missed if it was a coding video and I honestly wouldn't like that. I don't want to undermine sinitarium opinion but to share a different perspective! All the best
Not the video if you want to get a refresher on statistics. You're just throwing one definition after another into the explanation. Great... You know your stuff...good on you!
Yeah, that’s what I think it is in the end. I always thought it was weird that it would be used in cases where the statistic isn’t associated with a hypothesis test, but I guess it just stuck around as a norm
hire a better video editor who can do better do putting the graphics into more intiutiveness ans relatable. your explanation is good but the graphics and animations are not relatable.


The place where you link Probability with Statistics is really good..
It's really helpful to make a picture about the things you deal with in your daily work.
I love your way of introducing concepts. I am a Comp Sci. student currently getting into medicine and those videos are insanely helpful. Looking forward to your more advanced videos
This was great! Having done some self-study on statistics in the past year, these videos are great for re-stimulating all the connections and also seeing some familiar concepts in a new light.
Good thing it's Sunday. Professional relaxers only. We can never be fired.
I just took a stats course in my Data Science Masters, and this video was a perfect summation of it. We also used R to visualize the distributions, albeit we didn't use ggplot (which looks nicer and is better IMO). Great job!
I am still training to prepare to apply in Very Normal Company, this video really helps
Grateful to you ;as a grad student very helpful for me as a refresher video to go through
To complement your discussion on probability vs statistics, one can think of Probability as knowing the data generating process and studying the properties of the data generated by it, and of Statistics as knowing the data and studying the properties of the data generating process that could have generated it
I think “T” is used because it stands for “Test Statistic”. That is, the reason we’d be interested in a statistic is because of its distribution which would be related to figuring out how interesting the value of it is under our distributional assumptions.
That, or it stands for the “t” in statistics since “s” is already used for standard deviation and sometimes sum.
my new head canon is that T stands for “test statistic” now, thank you for that revelation
Great explanation! This really helped me put all these concepts together.
The best statistics channel ❤❤❤
This video is pure gold
Great video, thanks for your work! really clear and polish explanations
In 5:21 I believe there is an error.
A Probability distribution actually has a formal definition (see e.g. en.wikipedia.org/wiki/Probability_distribution#Kolmogorov_definition). It has to be a Probability Measure, implying that the function's domain is [0,1], (also its codomain is a sigma-algebra, so each input is a set...) and the result is a probability.
If you plug in half-open intervals (-∞, x] to a probability distribution, you get the cdf.
This distinction is actually important because there are discrete RVs, which have a probability mass function (pmf), and continuous RVs, which have a probability density function (pdf), but - and this is where it is relevant - there are also mixed RVs, that are described by neither.
This is a pain to deal with if you want to write a general form for anything - for instance an expected value. Still, with a little measure theory (and I mean really little, I hardly know any of it myself...) it is possible to generalise...
Yeah you’re right, I tried to simplify it to avoid dipping into measure theory. Thankfully we don’t have to deal with many mixed distributions in more everyday statistics, so it doesn’t come up a lot
Just a quick note, on 4:27 you said that all random variables have a pdf, but that is not always true. The easiest example is a cdf which is not differentiable, then the pdf can not exist. Much more complicated examples can be constructed, but the previous is a quick one.
Thanks for the correction. I should have added a qualifier that it’s random variables that we usually deal with in basic statistical models, but you’re right
It was helpful, thanks for creating it.
Love your channel! Thank you so much!
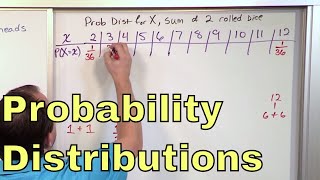
Nice video and example. On the r example part I have one question though. Why did you use "runif(2, min=1, max=6) %>% ceiling", it will never give 2 or 3 as a result because it rounds up. Wouldn't "runif(2, min=0, max=6) %>% ceiling" be better for the double dice roll.
Yeah I was supposed to use floor here, but accidentally used ceiling. The triangle distribution is shifted by one but I hope the point still goes across. Thanks for watching!
I found your channel and I feel like I find a gold mine. Hey, could recommend some books or resources for a beginner in stats .
great content. yet another banger. ✨
🙌
UNDERRATED
so good thank u for inspiring students to learn this
best in class
Subscribed and liked.
loved this one
great video, brilliant!
Is Probability distribution and frequency distribution the same thing
I haven’t heard it called a frequency distribution much, but it’s probably the same idea
Robot brain happy. Data input saved to hard drive.
The illuminati sound 😂🤣 at 5:00
I’m not an expert in R, but wouldn’t you need a uniform distribution from 0-6 if you’re rounding up?
Ah yes, you’re right, that’s an error on my part
Hello, I admire your enthusiasm and effort trying to make stats more approchable! Thanks :)
My 2 cents, I'm half way and learning a few things but how you are saying CDF and PDF too much while running somekind of powerpoint presentation with animations... I just want to say I personally find it distracting. I see you do have github with R code! I would rather have you talk me through this code in jupyter notebooks and spend more time makign those notebooks more accessible and use their ability to plot etc.. You could still thrown in memes and humour and stuff but I would keep the notebook in focus and always refer to it. Maybe it's just me! I don't mean to tell you how to do your thing heh I just find that it is the kind of learning that I need.
Cheers!
Thanks for the input, I appreciate it! Talking through code is something I’m still trying to figure out, so I’ll keep your suggestion in mind as I plan future videos
@@very-normal To give another input with a different opinion, I think your strenght is really visualzations and explaining the intuition behind concepts in a very clear and understandabe way (although it is true that in this specific video I also had some difficulty following when you repeaded PDF, PMF, CDF many times in a few seconds ahah) I think there are already too many videos on youtube on code, and what I really appreciate about this channel is the way you can convey with simplicity the intuition behind concepts, code doesn't allow this and there are only a few youtube channels that do it well. The whole concept of the video would be missed if it was a coding video and I honestly wouldn't like that. I don't want to undermine sinitarium opinion but to share a different perspective!
All the best
Not the video if you want to get a refresher on statistics. You're just throwing one definition after another into the explanation. Great... You know your stuff...good on you!
lol
Thanks for the content. Fewer memes please.
Man you're the best , keep going bro🤍.
"T" is Total?
Isn't a statistic denoted by "T" because it's also referred to as Test-statistic?
Yeah, that’s what I think it is in the end. I always thought it was weird that it would be used in cases where the statistic isn’t associated with a hypothesis test, but I guess it just stuck around as a norm
@@very-normal mmm yeah, i see
great video but the music is annoying!!
my b, i was still learning what works on yt at this point
hire a better video editor who can do better do putting the graphics into more intiutiveness ans relatable. your explanation is good but the graphics and animations are not relatable.
sorry im the only editor you got for now lol