Very nice! I feel like the "Echoes in Space" MOOC should cover much of this information in theory lectures. Dr. Stewart is doing tutorials here, but he is putting in nuggets of theory which have not been taught before in the MOOC.
I am PhD student and I have appeciate your job. I was very terrify by radar images but with your tutorials i'ts more and more clear now. Thank you very much for this tutorial well done. with my best wishes
Dear Dr. Chris Stewart, I do appreciate your updating tutorials on processing Radar Imagery with SNAP and thanks for this useful sharing. However, I do hope you will continue to upload further tutorials about the algorithms and practical analysis of agricultural yield predictions, especially Rice Yield Forecasting. I one of the other students who live in agriculture country want to do case study on rice yield prediction with GIS & RS in order to engage local farmers with traders by means of sharing crucial information, when, where, and amounts of production, to all relevant stockholders. These benefits are: 1. Traders or/and millers will start collecting rice on time and right place, 2. Farmers will gain an easy access to market, 3. Govs will easy to produce the precise report with reliable data, and 4. Policy makers will be able to make decision correctly regarding to the scientific statistics. Before reaching these stage, I would start improving this skill to be able to assess data precisely and correctly. Also, I would kindly request your help and advice to outline me on this field. I strongly hope that you will provide me the crucial approach to accomplish this task. Best regards, Tith
Very useful. How did you subset and still keep the metadata. I notice that it is still there when you stacked. When I add all the products there is no metadata. Thanks again for your excellent series on Sentinel toolbox.
Hello, I tried using the Graph Builder process on a single Sentinel 1 image, but it did not produce an image. The sigma bands of the output are just blank. What did I do wrong?
Hey did you download all of those images from GEE? Can't think of another way to handle large amount of imagery outside GEE. If so, why not download the ready to use versions?


![[Full Episode] The Restaurant War Thailand ศึกพ่อค้าซ่าแม่ค้าแซ่บ Episode 1 | 22 ก.ย. 67](http://i.ytimg.com/vi/BuzQ70v-UZQ/mqdefault.jpg)


Very nice! I feel like the "Echoes in Space" MOOC should cover much of this information in theory lectures. Dr. Stewart is doing tutorials here, but he is putting in nuggets of theory which have not been taught before in the MOOC.
I am PhD student and I have appeciate your job. I was very terrify by radar images but with your tutorials i'ts more and more clear now. Thank you very much for this tutorial well done. with my best wishes
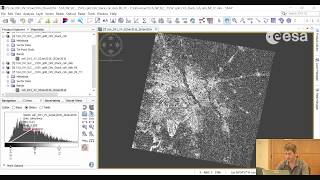
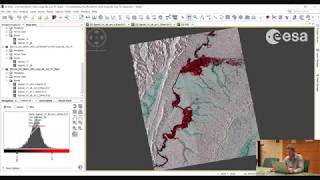
Covered here: Graph processing chain (Graph Builder), calibration, speckle filtering (Lee filter), terrain correction, Batch Processing, Create Stack, RGB composite images, overlaying shape files (Layer Manager), Time Series Analysis, Pin Manager, show time series for all pins.
Dear Dr. Chris Stewart,
I do appreciate your updating tutorials on processing Radar Imagery with SNAP and thanks for this useful sharing. However, I do hope you will continue to upload further tutorials about the algorithms and practical analysis of agricultural yield predictions, especially Rice Yield Forecasting. I one of the other students who live in agriculture country want to do case study on rice yield prediction with GIS & RS in order to engage local farmers with traders by means of sharing crucial information, when, where, and amounts of production, to all relevant stockholders. These benefits are: 1. Traders or/and millers will start collecting rice on time and right place, 2. Farmers will gain an easy access to market, 3. Govs will easy to produce the precise report with reliable data, and 4. Policy makers will be able to make decision correctly regarding to the scientific statistics.
Before reaching these stage, I would start improving this skill to be able to assess data precisely and correctly. Also, I would kindly request your help and advice to outline me on this field.
I strongly hope that you will provide me the crucial approach to accomplish this task.
Best regards,
Tith
SNAP is so simple and easy... awesome work of ESA..:) Many thanks. Regards from India.
Excellent! Very informative and clear. Thank you.
Highly descriptive !!! Thanks for sharing this tutorial.
very useful and applicable. thanks. please consider a tutorial for time series interferometry SBAS and PS. thank you again!
Hi Everybody! I was wondering why we wouldn´t include the subsetting in the processing chain?
Very useful and helpful..easy to do time series analysis
Excellent! Useful for my investigation.
Sir can u please post some tutorial regarding urban green space mapping ... using sentinel 1A in snap
Phenomenally useful and clear. thank you!
Thank you sir! regards from India...
Very usefull and helps me to finish my homework👍
Excellent! Thanks!
Very useful. How did you subset and still keep the metadata. I notice that it is still there when you stacked. When I add all the products there is no metadata. Thanks again for your excellent series on Sentinel toolbox.
Excellent. thank you
Hello Dr. I followed the same steps as you do but in stack process it show error java.lang.NullPointerException please guide.
Hello,
I tried using the Graph Builder process on a single Sentinel 1 image, but it did not produce an image. The sigma bands of the output are just blank. What did I do wrong?
I figured it out, just had to update SNAP
Hey did you download all of those images from GEE? Can't think of another way to handle large amount of imagery outside GEE. If so, why not download the ready to use versions?
Hi, Please how do you get the shapefiles?
what about the crop type classification using the supervised
I like make a question for a friends, how calculate the radar vegetation index with sentinel 1?
Does anyone know if you can use the batch processing for InSAR workflow if just the master is specified in the coregistration step?
it is useful but video for mac users will be helpful
great ... nice tutorial .. can u please suggest any tutorial where i can get help to monitor or map different crop by fusing optical and sar data
Hi, Vishal did you find material regarding your questions? I came here in search solution to the same question
Sir, Whenever I opened sentinal-1 data SNAP, it appeared in fliped condition. how do I resolve that?
With orthorectification, it depends from radar orbit during collection of the data, and S1 is a side looking radar. That's why You see it flipped