Creating Dynamic, Real-Time Maps with Operations Dashboard for ArcGIS

ฝัง
- เผยแพร่เมื่อ 22 ก.ย. 2024
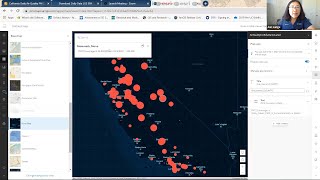
- Join us as we discuss Operations Dashboard for ArcGIS. This configurable web app provides an operational view of data, sensors, events, and analytics in a real-time, dynamic dashboard. First we will show you how to create your own dashboard, select elements such as charts and gauges, customize the layout, and integrate your agency’s data. We will then be joined by the Jacksonville Sheriff’s Office who will show us how they are building Ops Dashboards to support their agency’s objectives.
For more information, please visit: p.ctx.ly/r/9d9w
---------------------------------------------------------------------------------------------------
Follow us on Social Media!
Twitter: / esri
Facebook: / esrigis
LinkedIn: / esri
Instagram: / esrigram
The Science of Where: www.esri.com


How do you get the data first? The one of the map before inserting it on the dashboard? I see that by creating a map you can get the option of online map sources, but what if I need something that is not there and must be real-time data? For example precipitation data. Where can I get the real-time precipitation data running in a dashboard?
[16:00] the how-to starts here
Hello! Very good video, I have a question about the calculation of response times and their visual arrangement. I have a table of attributes with the start and end times of a call, its assignment to field personnel, and subsequent resolution. Can I calculate the average time in minutes for both stages? What tools does the dashboard manager have to include this in a viewer? Greetings from Maipú, Santiago de Chile.
thanks. this is awesome
It is point. What if i change the color of area polygon based on filter on list ?
can I look at the attribute data as a comparison for the exercise?
I would like to know how to fix the list of layers in the dashboard with arcgis online. Can you help me please.
Hello, am very much interested in your products..Please can I lisae with one of your technical officer's to get more information..Based on my organisational need.
I can't find operations dashboard in arcgis online
I’m trying to get real time layers (gps tracks) included in our operations dashboard. If I get geoevent server will I need to run it on a dedicated server that is always running. In other words, will it cease to function if I try and run geoevent on my personal work computer and restart. Also, will I need arcgis server as well or will geoevent be enough?
I have two surveys which consists of several agree/disagree questions. They are the same questions, only one survey is a "before" survey and the other suvery is an "after" survey. Is there a way to create a grouped serial chart showing the before/and after as two different bars on the same chart?
I had a similar problem with including more than one layer in a single list/chart etc. I’m trying a workaround now by building a single survey that starts with a drop down asking which type of report is being filled, then using the feature on the drop down to only have certain fields appear when report “x” is selected, and different fields of report “y” is selected. This way all my fields are now in a single layer and I can create charts and lists to compare and relate multiple surveys.
How to update the data on daily basis?
You know when you can click on a data point in an interactive map and it, for example, has a little pop up to it that has a picture of what that data point represents and a few other attributes to it? (A shark tracking map would have each datapoint contain a picture of a shark, the name, weight, etc). Can I do that in dashboard or do I have to have all of those modifications completed in whatever software I create my data points in before adding it to the dashboard?
Did you figure this out? If you did, would you point me into the direction for learning how to do it?
Do it in the map popup you inserted into the Dashboard using Arcade expressions.
How to link/add real time data in AGOL?
Good stuff but: 1) it possible to alter the default background layer; i.e. go from black to a regular world map background? And to make the font size of the Elements bigger? 2) can a real time Heat Map be added to the Dashboard?
PLEASE RESPOND ASAP!
you may want to email or call
my credit is over,i made half dashboard work.what i do ?is any option without pay money.or another way to create dashboard
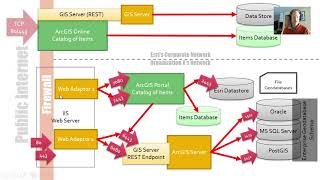
ArcGIS Enterprise configuration and dashboard creation th-cam.com/video/2ncpq2010s8/w-d-xo.html
Thank you for the very informative session but unable to open the mentioned link
esri.box.com/v/LEdashboardwebinar
Waqar Ul Islam ArcGIS Enterprise configuration and dashboard creation th-cam.com/video/2ncpq2010s8/w-d-xo.html
😎
👍🏾🌎🌏🌐🌍