This guy is amazing! You have helped me tremedously throughout my thesis writing. Whatsapped him and he replied instantly. I wish you nothing but the best in life and to have plenty of rezeki
Thank you for the great video! However, since Likert scale data is ordinal, calculating the mean isn't appropriate. Instead, it is recommended to use median and/or mode - correct? Thank you!
I don't agree. I think that with ordinal variables you can use for example: Mann-Whitneys U-test or Chi-squared test. Not the t-test unless you make a sum variable from multiple ordinal variables.
Sir, How can we convert several likert scale data into single frame?like my work is on management quality so i have many questions on management services and want to bring up these on a single frame .what should I do ?...it will very kindness to you if you help me for that..
🟨📌 For assistance with data analysis, kindly contact me via this email: datanalysis93@gmail.com or WhatsApp: +212619398603 / wa.link/l6jvny Facebook: facebook.com/benhima1/ Instagram: instagram.com/medbenhima2015/ LinkedIn: www.linkedin.com/in/mohamed-benhima-phd-6a1087109/ TikTok: www.tiktok.com/@mohamedbenhima?is_from_webapp=1&sender_device=pc Google Scholar: scholar.google.com/citations?user=mx0JUzQAAAAJ&hl=en Researchgate: www.researchgate.net/profile/Mohamed-Benhima Twitter: twitter.com/Mohamed_Benhima WhatsApp: +212619398603 / wa.link/l6jvny E-mail: Datanalysis93@gmail.com 🟨Get customizable templates developed over eight years of research work experience: 📄The Likert scale template in MS Word: redev.gumroad.com/l/plqxg 📄✏: Customizable research templates catalogue: redev.gumroad.com/ 📄✏: Likert scale survey 1: Get a Likert scale template customizable in Microsoft Office Word via: redev.gumroad.com/l/hmmwj 📄✏: Likert scale survey 2: Another short version of a five-point Likert scale in MS Word: redev.gumroad.com/l/ptsbz 📄✏: Likert scale survey 3: redev.gumroad.com/l/oxnve 📄✏: Likert scale reliability report template: redev.gumroad.com/l/jdbxdz 📄✏: Lkert scale EFA, CFA, PCA, Eigenvalue, Cronbach alpha reliability, Kaiser-Meyer-Olkin (KMO) Measure of Sampling Adequacy, Bartlett's Test of Sphericity: redev.gumroad.com/l/cynbjf 📄✏: Mediation analysis template: redev.gumroad.com/l/yeaff 📄✏: Moderation analysis template: redev.gumroad.com/l/atsdw 📄✏: Ten customizable Likert scale templates: redev.gumroad.com/l/qcamn TH-cam channel: th-cam.com/channels/jlkoygcYEE-jNwTZKUMmqw.htmlth-cam.com/users/sgaming/emoji/7ff574f2/emoji_u1f4c4.png
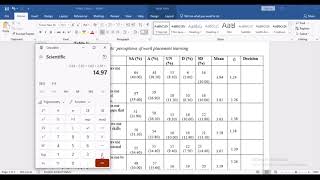
Please help! I wanted to do following and need your help: 1. How to create demographic information tabel. Like age, gender, country, religion etc. Including means, SD, Range, percentage, N and so on ? Just like in scientific Artikel. 2. How to filter some part of data. For example we collected the data in 3 different times over a period of one year. So basically there are some people who did participate in 1. experiment but didn't in time 3 i mean they didn't continue the whole year. Now i just want to compare the 1. Times and the 3. Times of the persons who took part in all 3 times and not only once. How can i filter or select only those, who did the whole experiment? 3. How can i compare the first time with the second time or 3rd time to see if there's any difference between in case of health situation. I mean if they were healthy at the beginning are the now seek and vice versa? I wanted to do T, test. Can you please tell me what kind of test do i need to do? Im writing my bachelor thesis in psychology and have no clue of SPSS. Please help me and send some videos that show this Prozesse. Thanks for your help 👍
@@MohamedBenhimaPhD i want to compare the progress of mental health over a period of a year. We tested 3 times over a year. Now i want to see, if there is different between 3 times. Which kind of test should i chose?
@@stopworrying8850Yes, I see. As you know there are several statistical tests that could be used to compare the progress of mental health over a period of a year, depending on the specific details of your study and the type of data you have collected. One test for comparing multiple groups over time is the repeated measures ANOVA. This test can be used to determine if there is a significant difference in mental health scores between the three testing occasions. Another option is the Friedman test which is a non-parametric test, similar to the repeated measures ANOVA, but does not assume that the data is normally distributed. This test can be used when the data is ordinal or continuous. you can also use a paired t-test to compare the mental health scores at each testing occasion to a baseline score or to each other.
No, no, no! You can’t run parametric tests with Nominal or Ordinal data. What does a “mean” of 3.44 actually mean when you are working with qualitative data. There is no 3.44 on a Likert scale! It would be like taking the jersey numbers on a football team, adding them up and dividing the sum by the number of members on the team. Nonsense answer! Your research question doesn’t justify misusing the level of measurement of your data.
I am also very confused. These videos are of immense help but I think my fundamentals aren't strong enough. I am dealing with a 3-point Likert scale for an attitude test but I am so confused if I can use the mean and SD there...what statistical test can be used with Ordinal data.
How is it a nonsense answer? Actually curious. In the most simplistic sense, if your sample has a mean of 3.5 on a 1 to 5 scale, it tells you where your sample lies on the scale, as a whole.
You can use parametric tests and mean/stdev on Likert scales (pseudo-quantitative scales derived from Likert items e.g. by averaging the scores), but not the items... And yes, Likert items are ordinal (it does not depend on the research objective, lol) and the scales are pseudo-quantitative. I strongly advise not to advise others before completely understanding the concepts yourself (I'm addressing the Author of the video here).
I doubt if you are a statistician. Likert scales are ordinal but when it has at least 5points, it can be treated as interval variable which is continuous. So, if it is a measure of satisfaction for instance, u can then use mean to compare how satisfied the respondents are using a grouping variable, ok? Thanks
You just saved me! i have done the analysis but so unsure if i am write because i read elsewhere than using mean to interpret likert scale is inappropriate so i have spent hours thinking and finding solution on youtube. i am submitting my capstone project today
Hi. I'm actually confuse about the data of my research. My statistician used this One-Way ANOVA in SPSS, but I'm struggling in how should I interpret the significance difference between the demographic profile (Age, Sex & Year Level) and their language attitude. Can I ask for your help about this?🥺 I badly needed the exact result about the significant difference 🥺 Cause really, I don't know how. Thank you..
From the data that I have, in my 2-part, 20-item, 5-point Likert Scale, every statements shows "Sig.". So I'm really confused on how it turns out? Since, I'm asking if there's significant difference between demographic profile and language attitude. Hoping that you could help me with this. thank you so much!
How to find correlation between 2 ordinal variables ... Will chi square independence work? If yes, How to do it? Are there any conditions thay we need to fulfil?


If we have to find mean and median of qualitative variables then firstly we should compute them
Mohamad, you're a legend. Thank you for helping me with my UK undergrad dissertation. :)
This guy is amazing! You have helped me tremedously throughout my thesis writing. Whatsapped him and he replied instantly. I wish you nothing but the best in life and to have plenty of rezeki
His number please
His phone number if you don't mind
@@mbinyuisidiki9726 its in the description box
how can we find frequency of qualitative variables
Thank you for the great video! However, since Likert scale data is ordinal, calculating the mean isn't appropriate. Instead, it is recommended to use median and/or mode - correct? Thank you!
I don't agree. I think that with ordinal variables you can use for example: Mann-Whitneys U-test or Chi-squared test. Not the t-test unless you make a sum variable from multiple ordinal variables.
Sir, How can we convert several likert scale data into single frame?like my work is on management quality so i have many questions on management services and want to bring up these on a single frame .what should I do ?...it will very kindness to you if you help me for that..
You can compute the overall mean or median of each scale
What will be suitable most for sum up likert scale mean value or it's overall median value ??Thank you so much sir..
Are you sure that you can just assign number to the categorical data and using parametric stat?.
Thank you so much! Came across a bit of confusion when analysing my data for a research investigation but now I'm all good! thank you for helping :)
I'm not getting the number of respondents I need, this there's away to manipulate it ?
Hello i have a questionare of my friend, i am in delima for it's analysis could you please help me out
is this spss or Smart pls?
SPSS
My Brother, you're a lifesaver !! I just pray for you , your family , your parents and wish you every success in life.
Kindly make a video on analysis of 4 point likert scale...or even items likert scale
I think the same guidance applies
🟨📌 For assistance with data analysis, kindly contact me via this email: datanalysis93@gmail.com or WhatsApp: +212619398603 / wa.link/l6jvny
Facebook: facebook.com/benhima1/
Instagram: instagram.com/medbenhima2015/
LinkedIn: www.linkedin.com/in/mohamed-benhima-phd-6a1087109/
TikTok: www.tiktok.com/@mohamedbenhima?is_from_webapp=1&sender_device=pc
Google Scholar: scholar.google.com/citations?user=mx0JUzQAAAAJ&hl=en
Researchgate: www.researchgate.net/profile/Mohamed-Benhima
Twitter: twitter.com/Mohamed_Benhima
WhatsApp: +212619398603 / wa.link/l6jvny
E-mail: Datanalysis93@gmail.com
🟨Get customizable templates developed over eight years of research work experience:
📄The Likert scale template in MS Word: redev.gumroad.com/l/plqxg
📄✏: Customizable research templates catalogue: redev.gumroad.com/
📄✏: Likert scale survey 1: Get a Likert scale template customizable in Microsoft Office Word via: redev.gumroad.com/l/hmmwj
📄✏: Likert scale survey 2: Another short version of a five-point Likert scale in MS Word: redev.gumroad.com/l/ptsbz
📄✏: Likert scale survey 3: redev.gumroad.com/l/oxnve
📄✏: Likert scale reliability report template: redev.gumroad.com/l/jdbxdz
📄✏: Lkert scale EFA, CFA, PCA, Eigenvalue, Cronbach alpha reliability, Kaiser-Meyer-Olkin (KMO) Measure of Sampling Adequacy, Bartlett's Test of Sphericity: redev.gumroad.com/l/cynbjf
📄✏: Mediation analysis template: redev.gumroad.com/l/yeaff
📄✏: Moderation analysis template: redev.gumroad.com/l/atsdw
📄✏: Ten customizable Likert scale templates: redev.gumroad.com/l/qcamn
TH-cam channel: th-cam.com/channels/jlkoygcYEE-jNwTZKUMmqw.htmlth-cam.com/users/sgaming/emoji/7ff574f2/emoji_u1f4c4.png
This is outstanding video for data analysis, kindly help me to know the cost of research guiding
Thank you, very helpful and simple way of explaining
You are welcome!
mean, median, mode, standard deviation and range only?
I think that is enough for descriptive statistics
Amazing video, I rarely comment but you've been so helpful to me! Thank you!
Plz told me about data screening and normality?
Cutpoint detail ?
Please help!
I wanted to do following and need your help:
1. How to create demographic information tabel. Like age, gender, country, religion etc. Including means, SD, Range, percentage, N and so on ? Just like in scientific Artikel.
2. How to filter some part of data. For example we collected the data in 3 different times over a period of one year. So basically there are some people who did participate in 1. experiment but didn't in time 3 i mean they didn't continue the whole year. Now i just want to compare the 1. Times and the 3. Times of the persons who took part in all 3 times and not only once.
How can i filter or select only those, who did the whole experiment?
3. How can i compare the first time with the second time or 3rd time to see if there's any difference between in case of health situation. I mean if they were healthy at the beginning are the now seek and vice versa?
I wanted to do T, test.
Can you please tell me what kind of test do i need to do?
Im writing my bachelor thesis in psychology and have no clue of SPSS. Please help me and send some videos that show this Prozesse. Thanks for your help 👍
Actually, you need SPSS, R, Jamovi or Jasp software
@@MohamedBenhimaPhDi have spss . I just want to know which tests. Anova, gln or som
It actually depends on your research questions and hypotheses
@@MohamedBenhimaPhD i want to compare the progress of mental health over a period of a year. We tested 3 times over a year. Now i want to see, if there is different between 3 times. Which kind of test should i chose?
@@stopworrying8850Yes, I see. As you know there are several statistical tests that could be used to compare the progress of mental health over a period of a year, depending on the specific details of your study and the type of data you have collected. One test for comparing multiple groups over time is the repeated measures ANOVA. This test can be used to determine if there is a significant difference in mental health scores between the three testing occasions. Another option is the Friedman test which is a non-parametric test, similar to the repeated measures ANOVA, but does not assume that the data is normally distributed. This test can be used when the data is ordinal or continuous. you can also use a paired t-test to compare the mental health scores at each testing occasion to a baseline score or to each other.
How to put stakeholders response directly in spss
No, no, no! You can’t run parametric tests with Nominal or Ordinal data. What does a “mean” of 3.44 actually mean when you are working with qualitative data. There is no 3.44 on a Likert scale! It would be like taking the jersey numbers on a football team, adding them up and dividing the sum by the number of members on the team. Nonsense answer! Your research question doesn’t justify misusing the level of measurement of your data.
I am also very confused. These videos are of immense help but I think my fundamentals aren't strong enough. I am dealing with a 3-point Likert scale for an attitude test but I am so confused if I can use the mean and SD there...what statistical test can be used with Ordinal data.
How is it a nonsense answer? Actually curious. In the most simplistic sense, if your sample has a mean of 3.5 on a 1 to 5 scale, it tells you where your sample lies on the scale, as a whole.
You can use parametric tests and mean/stdev on Likert scales (pseudo-quantitative scales derived from Likert items e.g. by averaging the scores), but not the items... And yes, Likert items are ordinal (it does not depend on the research objective, lol) and the scales are pseudo-quantitative. I strongly advise not to advise others before completely understanding the concepts yourself (I'm addressing the Author of the video here).
I doubt if you are a statistician. Likert scales are ordinal but when it has at least 5points, it can be treated as interval variable which is continuous. So, if it is a measure of satisfaction for instance, u can then use mean to compare how satisfied the respondents are using a grouping variable, ok? Thanks
It indicates a tenancy not an absolute, so it does make sense , tendancy is to agree or disagree
You are so good, Sir. i've just subscribed to your channel.
Hey I'm from Guyana. Do you mind helping me cause I'm till lost. It's my research assignment 5:14
Thank you
Hi How would you figure out the percentage comparison of likert scales please
th-cam.com/video/mE0mCerFIe0/w-d-xo.html
That's very insightful.
Thank you very much 👍👍👍
Most welcome:)
Is this the AHP method?
@@IrmakAKSOY-c2e What do you mean by AHP?
@@MohamedBenhimaPhD the analytic hierarchy process method
You just saved me! i have done the analysis but so unsure if i am write because i read elsewhere than using mean to interpret likert scale is inappropriate so i have spent hours thinking and finding solution on youtube. i am submitting my capstone project today
Thanks brother thank you so much finally i have learnt
Thank you so much so muchh
You're welcome!
You are really the best, thank you so much for this tutorial, it helped a lot
Glad it helped
Vry clear and informative information
Glad to hear this!
Hi. I'm actually confuse about the data of my research. My statistician used this One-Way ANOVA in SPSS, but I'm struggling in how should I interpret the significance difference between the demographic profile (Age, Sex & Year Level) and their language attitude. Can I ask for your help about this?🥺 I badly needed the exact result about the significant difference 🥺 Cause really, I don't know how. Thank you..
From the data that I have, in my 2-part, 20-item, 5-point Likert Scale, every statements shows "Sig.". So I'm really confused on how it turns out? Since, I'm asking if there's significant difference between demographic profile and language attitude. Hoping that you could help me with this. thank you so much!
It depends on the significance level or p-value. If it is equal to or less than .05, it is statistically significant
There are just 2-3 statements that have less than 0.05
I've sent you a message through tg. So that I can send some screenshots of my data. Thank you so much.
@@marieellainemacarang7777 you can use WhatsApp
If my data 5-likart scale and I want to use parametric test how can I do this ?
What parametric test would you like to use exactly as they are many?
@@MohamedBenhimaPhD I mean that my data not with normal distribution and I want to use parametric test is that possible?
Thank you.
How to find correlation between 2 ordinal variables ... Will chi square independence work? If yes, How to do it? Are there any conditions thay we need to fulfil?
You can go for Pearson, spearman and Kendall's tau b
You can use them all without checking any conditions
Thanks so much for your explanation.