Create Speedometer Chart In Excel

ฝัง
- เผยแพร่เมื่อ 18 พ.ค. 2013
- Create Speedometer Chart In Excel, Download link bit.ly/2GWi6i0 a Doughnut chart and Pie Chart is used in order to accomplish the speedometer graph.
Watch the video for more details on how to create a speedometer chart in excel
10 Most Used Formulas MS Excel
• 10 Most Used Formulas ...
Learn Basic Excel Skills For Beginners || Part 1
• Learn Basic Excel Skil...
10 Most Used Excel Formula
• 10 Most Used Excel For...
*Most Imporant Excel Formuls Tutorials*
Learn Vlookup Formula For Beginners in Excel
• Learn Vlookup Formula ...
5 Excel Questions Asked in Job Interviews
• 5 Excel Questions Aske...
Create Speedometer Chart In Excel
• Create Speedometer Cha...
Learn the Basic of Excel for Beginners || Part 2
• Learn the Basic of Exc...
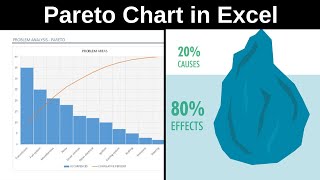
Create Pareto Chart In Excel
• Create Pareto Chart In...
How to Create Dashboard in Excel
• How to Create Dashboar...
Excel Interview Questions & Answers
• Excel Interview Questi...
To watch more videos and download the files visit : www.myelesson.org
To Buy a Excel Course visit :www.myelesson.org/product 10 Most Used Formulas MS Excel
• 10 Most Used Formulas ...
Learn Basic Excel Skills For Beginners || Part 1
• Learn Basic Excel Skil...
10 Most Used Excel Formula
• 10 Most Used Excel For...
*Most Imporant Excel Formuls Tutorials*
Learn Vlookup Formula For Beginners in Excel
• Learn Vlookup Formula ...
5 Excel Questions Asked in Job Interviews
• 5 Excel Questions Aske...
Create Speedometer Chart In Excel
• Create Speedometer Cha...
Learn the Basic of Excel for Beginners || Part 2
• Learn the Basic of Exc...
Create Pareto Chart In Excel
• Create Pareto Chart In...
How to Create Dashboard in Excel
• How to Create Dashboar...
Excel Interview Questions & Answers
• Excel Interview Questi...


I've never seen anyone so excited about Excel in my life.
Great tutorial.
Thisssssssssssssssss :D so much excitement
So cute!!
Very nice
@@michelleh2702
, ,
Z
,
It's so amazing the way you are taking so much pleasure in what you are doing and teaching. One perfect example of the person who loves his job! Was real fun watching the video!!! Thank you for uploading.
I never like to add comments. That said, I really appreciated your tutorial and your personality. Many times, people are boring or long-winded. Your laughter is contagious. Please keep sharing with the world!
My only critique was that I had to try a few times without understanding what I was doing wrong because I couldn't see my pointer. I finally realized my since data was much larger than yours, my needle Pointer value set at 1 was invisible, so I had to increase it to at least 50 to see it. (My end data value was 7250) So, for very high values/data, the pointer value should also be increased to compensate.
Overall, this tutorial was fabulous and I can't wait to show my coworkers the graphic I made with your help!
Have a fabulous day!
its incredible the excitement that you transmit with this tutorial, looking forward to start the lessons with your course
If the pointer is behind the donut chart - click on the pointer on the chart, once it is selected, right click, choose "format data series", in the window that pops up, on series option tab at bottom choose "secondary axis" in the "plot series on". this brings the pointer forward
+Charles Edwards Thanks!! i was facing this problem
+Charles Edwards THANKS! Was having this issue. Much appreciated.
Thank you so much. I was having this problem and you solved it for me. Thank you to the video poster and you both!
thanks. i have the same issue about the pointer. (: great.. really great.. never expected that we can do more about excel....
@Charles Edwards This doesn't work for me. It hides the first chart and I'm left with ONLY the pointer. :(
9 Years later and you're still teaching people awesome tricks in your videos. Also, I love your enthusiasm!
This is so great and indeed if this was how I was taught math at school- the sense of humor would make me a guru!! Thank you.
Denis Igua Thanks for the kind words: )
had a rough day; but your video made my day! "chart is so cool.. so fun.." haha thank you so much.
Nice tutorial! Thanks for making it!
As a side note, my pointer got stuck behind the main chart. But, reformatting it to be on the secondary axis remedied that.
Es una de las mejores creaciones que he visto utilizando Excel. Felicitaciones excelente video.
Love your enthusiasm brother!
Welcome Dear, you can watch all my videos on www.myelesson.org
Thank's! I was looking for this to make a BMI chart. Your approach is genius and I love your enthousiasm!
I like how happy you sound while creating this file!!! haha loved it!
I agree : thank you not only for the tutorial but for your great spirit and laughs !
This is FANTASTIC!! Thanks so much - easy to do and your approach was easy to understand.
Thank you!
Had to go through it step by step in my own example, but finally got there with it. Very useful
Hi Guru, I very much appreciate what I learnt from this video. Thank you for sharing your knowledge and time to educate so many.
Good Job and I wish you all the best.
you're not just informative but quite enthusiastic as well.
this actually helps in concentration
WoW!! Thanks for the Tutorial Guru, this old(ish) 'Exceler' has learnt an awesome Magic Trick! I like your style and passion too, dude!!👌👍
Wow...I even got this to work in Excel for Mac through some trickery (copy/paste chart to insert second series, put first chart element to 50% transparency). Been looking at other ways of creating speedometer charts, and this is the best! Thank you!
J. Scott Lane can you share it please
Some people have enthusiasm and some have even more enthusiasm coupled with a layer of warmth that makes this video a greate training aid. There's more than just an Excel lesson here.
Thank you for the kind words.
Perfect and speedy enough for a techy. I also enjoy his laugh! These charts are great for business data.
+Charles Padera Thank you for the kind words :) you can watch all my videos on www.myelesson.org
GuruJi: You are not only very informative, you are also hilarious!!!! Thanks a bunch!!!!
Ur smiling face... Makes excel very easy
I never imagined anyone to be more excited about excel than me....you are a legend
Debbie Matthews Matthews Thank you sooo much dear.
I really enjoyed this lesson. Thank you so much for sharing!
Heather Angelus Welcome :)
Jolly teacher !! Easily doubles up as a Performance Indicator indicator.
Guru Ji... You are awesome. Can't imagine the innovation you have come up. Thanks for sharing...
You Sir . . . are the Master!! Thank You for sharing.
You are a grate teacher ..most of the people doesn't like share his knowledge with others ...then your very special for me ...thanks your video ..
Welcome Dear and thank you for the kind words.
Loved your enthusiasm and your exposition of this technique. Thanks very much.
I have never had an excel tutorial brighten my day. Thanks! and now i have sweet condition graphs
:)
Wonderful Guru. Like how the simple chart is converted into a fun chart.
Your enthusiasm is infectious. You have an amazingly fetching voice- I think you could easily provide voiceovers for advertisements :)
This is super. Loved the excitement with which you explained the entire process.
thank you brother.. this is very helpful and informative and friendly way of teaching.. Great job and God bless you .. keep it up
The happiest lesson I have ever come across...well done
Superb. I agree that your enthusiasm is contagious! Loved it. Thanks. Krishna
+Krishna Kumar Welcome , you can also watch all my videos on www.myelesson.org
what a lifesaver, thank you so much for this tutorial! Your joy and enthusiasm also MADE MY DAY!!! I want to show this to some of my students who say "I can't make excel sound exciting in a presentation." :0)
Hearing you laugh while I'm worried about how to get this excel presentation in time put things into perspective for me that it's important to have fun with all of this. Thank you!
I never enjoyed before a tutorial as much as I did with this one!! Thanks a lot
+Luis La-Rotta Welcome, please visit www.myelesson.org for more videos
Love your enthusiasm! Thanks for a great tutorial!
You really seem to be having fun in this lesson and I in turn had fun learning it. Thank you so much for both for sharing the knowledge and your joy in doing so.
Fantastic tutorial and great to see an enthusiastic host! thank you!
Wow... the way you explained was wonderful. Any dumb can easily follow, you are a great teacher. I wish if I had a teacher like you :). Thanks a lot for sharing your knowledge.
Sir ...first of all...Nice to explain your colloquial and things ...valuable vedio for me....thanks.
Thank you a lot! God bless you! You improve my EXCEL practice.
+Luc Armand BOHOULET Welcome, please visit www.myelesson.org for more videos
Sir you are owesome 🙏🙏.
Charan sparsh I have learned this from you as a guru 🙏
Excellent Lessen :) Thanks a lot pal. So well described, feels very easy now.
You are a freaking genius , thanks for the tutorial, was amazing.
Fantastic! Thank you for sharing your knowledge and enthusiasm.
Hi, This was great! At 6:15 in the video the Change Type Chart will look different in Excel 2013. It lets you select which chart to change. If you don't select the chart then it will replace your existing chart. Thank you. It is really great.Question: What formula did you use to get the pointer values to change automatically summing up to 100?
so good to see ur so enthusiastic way of teaching and talking in such a nice manner. keep it up.cheers.
Good sense of humour; very much appreciated!!!
What a joy to watch. If I ever meet you, I'll give you a hug!!
I really enjoyed your enthusiasm. Made me smile cause I was excited too! LOL
This is amazing - thank you so much!!
Really impressed
dude the way you are so happy is awesome
Thank you, Please visit www.myelesson.org to watch all of my training videos.
This is so clever. Indeed it is awesome. Thank you. Love your enthusiasm..
A very informative video. I really enjoyed the humor of the video instructor; the humor made a mundane topic interesting!
your lesson is awesome and funny too, it's sounds like excell is not complicated stuff...thanks bro
you are very simple ,and your lesson's it' very easy , thank you Sir
I added in this Speedometer a spin Button n its work in place of value..... when I click the button its work, thx GOD..!!!!!
thank You so much ...admired the way You teach , very energetic ..I have created my speedo meter , following the steps :)
Great stuff. Using Excel 2016, I couldn't get the needle to stay in the pie chart format, but it sort of worked as to donuts.
You are a star thanks for the video, a real eye opener
Thanks edwin ruzive
Hi Michael! I was finally able to get it to work! I changed the pie chart to a column chart first. I was hoping to do something with the secondary axis. I ended up not changing anything, but when I changed it back to the pie chart it was not longer hidden!
hi sir Good evening I watch your video its really Good easy way to teach us. once Great thanks
Welcome, you can watch all my videos at www.myelesson..org
very excited and interactive way of teaching. super and all the best for all ur future teachings
YOU SAVED THE DAY! Thank you so much!!!
Very well presented and easy to build - a nice way to motivate people to learn. Thanks for the valuable demonstration,
Thank you : )
You are a great teacher. Awesome tutorial!
God, lol, I love how much fun he is having as he makes this.
Thank you so much! Your demo and expkanation is easy to understand and follow
Fantastic video tutorial. it was very easy to follow and do it. Love your style.
soooo fun sooo fun to make!
Speedometer functions with explanation
th-cam.com/video/Po426vluEOI/w-d-xo.html
Man .. you are great informer with a very exciting mood .. i learned from your video and applied it .. Easy and Fun .. Thank You
Had fun listening to you made it interesting and easy.
tumba channagide sir I mean soooo super
Thank you! It's beautiful, and I thought it was awesome you were having such a great time :) Careful with the background noise when recording.
***** Welcome and thanks Friend :)
Thank You very much sir....
With the help of your video I teach a lot of people associate with me in office as well as at home ....
keep sharing.....
This is such an awesome lesson. You are so happy and enthusiastic. Well done Bro
Bruv327 Thanks :)
Guru ji...Thanks a lot for teaching an awesome chart in a very brilliant way.
You are welcome
Very nicely explained. Hats off to you Sir.... Gr8. Thank you very much
Thank bro. i managed to follow your steps and get it right
Awesome !
try this . I implemented to my source code
Function GaugeMeter(rng As Range) ' DrawGaugeMeter
'Application.ScreenUpdating = False
Dim ActSheet As Worksheet
Set ActSheet = ActiveSheet
Dim chartTtitleValue As String
Dim targetCellValue As Double
Dim vtop As Integer
Dim chartName As String
If (rng.Count = 2) Then
chartTtitleValue = Range(rng.Address).Cells(1)
targetCellValue = Range(rng.Address).Cells(2)
vtop = (rng.Row - 1) * 100
Dim chtObj As ChartObject
'Create a chart
Set chtObj = ActiveSheet.ChartObjects.Add(Left:=100, Width:=100, top:=vtop, Height:=100)
'Give chart some data
chtObj.Chart.ChartType = -4120 ' xlDoughnut
chartName = "chart" + CStr(rng.Row)
chtObj.name = chartName
Dim s1 As Series
Dim pts1 As Points
Set s1 = chtObj.Chart.SeriesCollection.NewSeries
With s1
.name = "Speedometer"
.Values = Array(0, 2, 3, 5, 10) ' 5 points 'point
'start point , initial point, mid point, max point
End With
chtObj.Chart.ChartGroups(1).FirstSliceAngle = 271
Set pts1 = s1.Points
pts1(1).Interior.ColorIndex = 3 ' red
pts1(2).Interior.ColorIndex = 45 'amber
pts1(3).Interior.ColorIndex = 4 ' green
pts1(4).Interior.ColorIndex = 5 ' blue
pts1(5).Interior.ColorIndex = 0
chtObj.Chart.HasTitle = True
chtObj.Chart.ChartTitle.Text = chartTtitleValue
chtObj.Chart.HasLegend = False
Dim s2 As Series
Dim pts2 As Points
Set s2 = chtObj.Chart.SeriesCollection.NewSeries
With s2
.name = "Pointer"
.Values = Array(targetCellValue, 0.2, 10) ' 3 points
'valuer point , pointer marker point, max point
End With
Set pts2 = s2.Points
s2.ChartType = 5 'xlPie
s2.AxisGroup = 2 'xlSecondary
chtObj.Chart.ChartGroups(2).FirstSliceAngle = 271
pts2(1).Interior.ColorIndex = 0 ' empty
pts2(2).Interior.ColorIndex = 1 ' black
pts2(3).Interior.ColorIndex = 0 ' empty
pts2(2).HasDataLabel = True
pts2(2).DataLabel.Text = targetCellValue
pts2(2).DataLabel.Font.ColorIndex = 1 'black
s2.HasLeaderLines = False
' Application.ScreenUpdating = True
Else
'nothing
Debug.Print "else"
End If
GaugeMeter = ""
End Function
Superb super you are a greater man you really enjoy excel way of teaching awesome 👏👍❤❤
thanks bro, appreciate this video. to move the needle to the front right click, series options, plot series on.
when in doubt right click.
I like this video so much .I learn something new about excel after watching your video.
+Zaibun Nisa Thank you for the kind words :)
Dude, I love the style, so interacting and entertaining ... Thumbs Up.
I like the enthusiasm 😂 thanks for this video 👍👍👍👏👏👏
I really enjoy your passion for this!
I love your style of presentation and really really neat speedometer!
Thank you
this is amazing.. seriously.. thank you so much for sharing the knowledge.
Thank you, Please visit www.myelesson.org to watch all of my training videos.
I am so happy to hear your happy teach voice. good job buddy
This is amazing! Thank you so much
i'm soo excited to use this for presentations
Thank you sir for letting me know how to create speedometer:)
Excellent tutorial video ! Thank you !
You are Cool Man! I loved this lesson! Simply Excellent!
Great!!!! Very Smart Congrats
You love your job, i love it. that was a great explanation - Easy to understand and very easy to create one.
cant resist subscribing... :)
Welcome dost :)