Hello Dan. First of all, I want to tell you that I really like your videos. Always interesting. Regarding this topic, is it possible to enable an observation using an aspect instead of annotated the code ? Thank you.
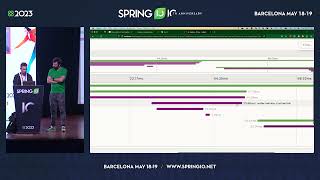
Dan thanks for that, I got used to the Netflix stack, transitioned to Micrometer and otel recently, nice it’s autoconfigurable now. But did you notice your AOP-annotated bean only measured 8.7ms as opposed to over 300ms before that, when you explicitly defined the span? Any idea what the auto-configured span measures?
@@marcingrzejszczak1716 sure, but that endpoint is supposed to fetch from a remote endpoint if I got it right. Unless the request was cached, it would take some 200ms for a roundtrip even after loading up all relevant execution paths, wouldn’t it?


very nice, my hair stopped becoming white once I completely migrated from laravel to spring boot, so friendly and complete framework.
Guess the co-pilot kept the video shorter than it should have been! Excellent video Dan
Been using the metrics actuator for a long while and love how easy it has become to wire in custom observability. Great tutorial!
Lovely Video! Dan is awesome.
Hi, Dan, thanks for the video.
Is there simplified way in new Spring observability to add and propagate both traceId and spanId across microservices?
Very helpful and concise video. Thanks a lot!
Hello Dan. First of all, I want to tell you that I really like your videos. Always interesting.
Regarding this topic, is it possible to enable an observation using an aspect instead of annotated the code ? Thank you.
Dan thanks for that, I got used to the Netflix stack, transitioned to Micrometer and otel recently, nice it’s autoconfigurable now. But did you notice your AOP-annotated bean only measured 8.7ms as opposed to over 300ms before that, when you explicitly defined the span? Any idea what the auto-configured span measures?
Maybe the JVM was warmed up? The first request is always slower
@@marcingrzejszczak1716 sure, but that endpoint is supposed to fetch from a remote endpoint if I got it right. Unless the request was cached, it would take some 200ms for a roundtrip even after loading up all relevant execution paths, wouldn’t it?
@@Nick-yd3rc I would have to debug this but I would be surprised if there was such a gigantic difference between AOP and code versions
Awesome. The Reslient is only observed if I create it over a Bean method. Is there another way to instrument the rest client ?
Great content! Practical live coding, latest. Thanks for your efforts
keep up the good work sir
Thank you for the useful content!👍
Thank you for you sharing !
The video looks a little bit cropped, but great content as always
I'm trying to zoom into code snippets at certain points of the video. Can you tell me is it just that or are you seeing other issues?
@@DanVega yes it was just that
@@DanVega perhaps add word-wrap when punching in so that you get what you want, without losing any of the text overflowing off camera / capture area
@@DanVega that was also the case in one of your recent YT shorts btw
Thank you so much☺
cant we track the trace between same class @observed calling another method which is in the same class also annotated with @observed
What is the difference between name and contextual name?
Anyone know how to get Spring Observability to export logs and not just traces to the otel-collecteor?
Great
Two words ... Java Melody
Why Maven and not Gradle? :)
Hello, what is the intellij plugin that help you generate code please ? thanks
He is using Intelli j Ultimate
Thx 💚
what ide is that?
thanks
180th...Thanks Dan
how come nobody is talking about open telemetry ?
Whoever chooses to rename javax to jakarta deliberately wanted developers to suffer in their migration
Blame oracle
😂😂😂
his playlist management esp Spring Boot is a big mess.....only reason not subscribed yet.
What does that even mean? I have playlists on Spring Boot, Spring Data, GraphQL, etc...
How are @GetExchange and @GetMapping compared?
Former for your web client which consumes a remote API, the latter for your controller which produces on your get endpoint.