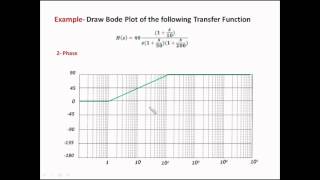
Thank you thank you thank you. i have a question though, how did we get 40db in 8:49 ? i have an exam next week and my teacher explains things really badly and the other videos have explanations that apply only to the example shown. you are an amazing teacher!


you have basically just saved me from a failed exam, thank you very much
I wish i found this video before my exam last week, it would've helped me pass it. 😢😢😢
i hope it helped you pass your second try! it sure did for me
better than my uni teacher who doesnt even teach
Thank you so much you save my life 💕
ok, so how come at 10^1 on the combined plot, we didnt have to worry about the -40dB gain value?
thanks
Thank you veryyy much for the guidance...means alott
This is better than my professor's class lol
Good job . Great Explanation :)
just perfect !!!
Why can't my textbook put it as simply as you did? thank you.
Thank you thank you thank you. i have a question though, how did we get 40db in 8:49 ? i have an exam next week and my teacher explains things really badly and the other videos have explanations that apply only to the example shown. you are an amazing teacher!
20dB/decade so the gain increases by 20dB each decade
Thank you, how to know the scale of y label from 40 to -160 dB.. any equation or something ?
Perfect 🙏🏼
thank you
Tysm❤️
ig there is mistake... the (s+1) bode plot slope will be -40dB/Decay..... so resultant graph shoudnt be the same as yours
what if i have two polynomials in the denominator
May i have the table of the bode plot please
Pdf image source please
Fundamentals of electrical circuits by Charles Alexander
After 10^2 shouldn’t slope be -60 dB/dec?
no bitch
you are right. She made a mistake there.
Ameer Ali Go read a signals and systems book. It’ll help you.
She's right. It is 20(purple) -20(blue) -40(green) = -40dB/dec.
@@CrustyRizzy chill out kid