
ฝัง
- เผยแพร่เมื่อ 5 ต.ค. 2022
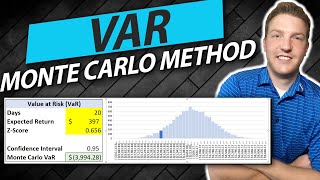
- How one can perform a Monte Carlo simulation for several correlated variables at once? This is often required for many quantitative finance applications such as basket option valuation, credit default swaps pricing, or value-at-risk estimation. Today we are investigating this technique using a Cholesky decomposition in Excel.
Don't forget to subscribe to NEDL and give this video a thumbs up for more videos in Risk management!
Please consider supporting NEDL on Patreon: / nedleducation


![[Live สด] การออกรางวัลสลากกินแบ่งรัฐบาล งวดวันที่ 16 มิถุนายน 2567](http://i.ytimg.com/vi/P3WkqO9gKjo/mqdefault.jpg)


You can find the spreadsheets for this video and some additional materials here: drive.google.com/drive/folders/1sP40IW0p0w5IETCgo464uhDFfdyR6rh7
Please consider supporting NEDL on Patreon: www.patreon.com/NEDLeducation
I was trying to figure this out on my own, was wasting too much time. Glad you have this posted.
This was super usefull for my job. Big thanks mate! Great explanation!
Great video, thank you. Straight to the point and very clear
Bro your video literally saved my day. Thank you so much!
Very Intuitive video. Multivariate data is always fun to work on !
Awesome video. How would you model correlated electricity and fuel prices in this way? Which distribution would you assume? Also how do you accurately estimate the correlation of time series data?
Thanks! I’ve already learnt a ton, you’re a star
Fantastic video! I have been looking for a good way to deal with correlated variables for a long time. I had heard of Cholesky decomposition but didn't know it could be used for this.
Hi, and thanks so much for the kind words! I have got a separate video on Cholesky here that covers the concept in a lot more detail: th-cam.com/video/B0wj9xYqw5Y/w-d-xo.html
great explanation. Thanks mate
Super video! Thanks
Further to my last comment - is that what forces the correlations to be maintained and therefore the portfolio means and standard deviations to be similar
Thanks… just submitted one of my assignments :) … with JetFuel Prices correlated with Exchange rate against US$… both moving and yet have some correlation..
Excelent video as always!
Out of curiosity, is it ok to use the empirical distribution of each stock when generating the uncorrelated Z-Stats?
Thank you for your great content. Could you make a video of how we can minimize the CVaR of a portfolio?🙏
Hello sir nice video but am wondering whether Cholensky Decomposition can be used if Distribution assumed is log-normal instead of normal? If not could you make a video where you show alternative method on how to do this if we assume Returns Distribution is log-normal?
Loved the video! Was wondering about the literature behind the method applied here for generating the correlated simulated returns. I would like to reference it in my paper! Thanks!!
Hi Labros, and glad you liked the video! This is one of the statistical methods that everybody knows but few know the original source it came from :) I believe you can use it without referencing (found many papers that do so), but my best bet at who proposed it originally is Solow (1985): link.springer.com/article/10.1007/BF01031616
can you explain more about what can we conclude from the simulation in the video. This video is fantastic
@NEDL Awesome video! Made this very difficult concept very easy to digest and understand, well done!
I don't know if it's possible, but was wondering if I could reach out to you and ask a few questions about something related to this topic, but using it in what might be an unusual fashion?
Let me know and if not, no hard feelings! Either way, thanks for the great video!
Hi Terry, and thanks for the comment! Yes, it is possible to reach out to me with questions and even schedule a one-to-one chat - I provide this as my Patreon benefits :)
Hey Sabha, i wanted to ask if can you use monte carlo to simulate the correlation coefficient. Correlation matrix table?
Great video, as always. Out of curiosity (I can't find it amongst your videos) do you have a video on the calculations of the five factor model, and your thoughts about it?
Otherwise that is a topic I would love to suggest!
Best
W
Hi Wilton, and thanks for the suggestion! I have got a video on a very similar topic in the pipeline :)
@@NEDLeducation fantastic! 😁🙏
@@NEDLeducation it's perhaps out of scope for you videos, but it would be interesting to hear your thoughts on some of the models being presented. The good, the bad, the ugly.
Perhaps that's for another playlist, but I would listen to it :)
Are the first columns of the Correlation Matrix and Choelsky decomposition expected to be the same as in this example ?
very helpful. can you explain how to do this with a portfolio of commodity futures including longs and shorts? for example, i may be spreading gold, so im long june and short dec. Thanks
great video - as usual - just wondering why standard deviation (variance) is often multiplied by square of time period (specially 252 ) ? i noticed that you haven't done that in the volatility calculation in this simulation . - thanks for the lessons once again
Hi Amit, and glad you liked the video! This is to annualise daily data - as there are 252 trading days in a year and volatility scales as a square root (variance scales linearly) with time. Similarly, you can use SQRT(12) to annualise monthly data or SQRT(52) for weekly data.
@@NEDLeducation thanks you so much .this means the simulation is running at daily .go it thanks
Savva!Is there a Way to incorporate heteroscedasticity and correlation to Monte Carlo generated Time series?
Is there a similar exercise that could use the covariance matrix instead of the correlation matrix ?
If I use a Triangular random number instead of Normal random, what should I do?
Thank you so much for the video. I implemented it in a totally different field and it works perfectly. My only question is how to implement the same method for different types of distributions (Beta, Gamma, Lognormal)? I would highly appreciate if you can just give me a hint. @NEDleducation
please did you get solution to your question?