it was unhelpful how you didnt show us how to get the p values using the old school t table way. not all of us will have that calculator you used on an exam
This tutorial went well up until you decided to use a calculator instead of the table. When you're teaching something, NEVER have "use an online calculator" as a step for it. It's like teaching someone how to replace a car tire by telling them "Just get someone to do it for you".
These videos have been amazingly helpful; Z and T test fully explained without using the table is what I live for. We are not allowed to use the table, for all you noobs out there.
Thank you! I'm going to go against the flow and say I'm grateful that you used the calculator... I'm learning this for a research project and I would rather not use a table :)
You were going well, until you used your calculator. You lost me all together after that. If you could show the t distribution table that would have been more helpful for me.
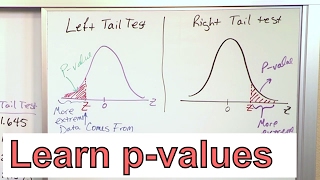
for the z score you said it represents the area on the left side of the value.... but you took the right side area after finding t score.....can you please explain?
I think theres also a third requirement. population should be approximately normally distributed. otherwise you cant use the t-test. e.g. for income you cant use it because its skewed (not normally distributed) but if you have n>30 you can use normal distribution = z.
Syed Kollol that's correct to get the probability above 80 0.50-.0860= (whatever the answer will be here) then multiply to 100 that would be the probability.
It is very helpful & easy to understand (thanks alot), i have a query, i appreciate if you help. (Query: I have around 200 historical data points(ex: lots vs. rejects), how to establish better control limits as per statistics for the rejects% ? {right now no limits available for the same}
Can you please please spend sometime working on this video again but using the t-table instead of the online calculator? I think some % confidence interval must be specified in order to use the table.
+Ali Reda Darouiche : no you shouldn't be lazy yourself, douche. He got you the t-score, all you have to do is follow the 8 df until you get 1.5. Obviously, the usual t-table wasn't created with thick heads like you in the mind. Now, if you follow the 8 df in the t-table, you will see that the probability of obtaining that amount is around 5-10% for one tail test (remember, sample mean greater than 80). Hence, 8.6% is between them ....he instead gave you the exact probability of scoring above 80.
We find a t score when we are given a little s (standard deviation of a sample) rather than lowercase sigma ( standard deviation of all values in a population). Typically, we don't have a population standard deviation and are more often given a sample to work with. At least, according to my stat instructor.
tell your students to pull out your calculator you had well they don't have it. it is a golden rule in math never use a calculator if your not teaching you students that then why are you in the education system your students will suffer in the long run they will make more mistakes when well if my employees can't do the math short hand then why am i hiring them


it was unhelpful how you didnt show us how to get the p values using the old school t table way. not all of us will have that calculator you used on an exam
i agree
This tutorial went well up until you decided to use a calculator instead of the table. When you're teaching something, NEVER have "use an online calculator" as a step for it. It's like teaching someone how to replace a car tire by telling them "Just get someone to do it for you".
SPLNKR If you aren't using a calculator good look on the AP exam
This along with a couple of other vids has really helped. Thank you.
These videos have been amazingly helpful; Z and T test fully explained without using the table is what I live for. We are not allowed to use the table, for all you noobs out there.
I am so glad I came across your channel, These videos help so much!!!
Thank you! I'm going to go against the flow and say I'm grateful that you used the calculator... I'm learning this for a research project and I would rather not use a table :)
This tutorial is awesome! We are allowed to use calculators, most real life situations you do anyway. :) thanks.
You were going well, until you used your calculator. You lost me all together after that. If you could show the t distribution table that would have been more helpful for me.
agree
can you show us how to get the area without using the calculator?
please use the T table... not the online calculator.. we can use that in an exam..
for the z score you said it represents the area on the left side of the value.... but you took the right side area after finding t score.....can you please explain?
I think theres also a third requirement. population should be approximately normally distributed. otherwise you cant use the t-test. e.g. for income you cant use it because its skewed (not normally distributed) but if you have n>30 you can use normal distribution = z.
Thank you very much.
Such a nice and clear video :)
One more awesome video. Fantastic !! Thanks so much.
Your answer is incorrect.
P(x>80) = 1-.0860=91.4% ; Which makes sense given the average of population in 75.
Your answer 8.6% is P(x
Syed Kollol that's correct to get the probability above 80
0.50-.0860= (whatever the answer will be here) then multiply to 100 that would be the probability.
Syed Kollol this is what I found in my book.
ah yes the probability on an equally distributed distribution on one side is more than .5 smh
Thank you for making this video! Very well explained
It is very helpful & easy to understand (thanks alot),
i have a query, i appreciate if you help.
(Query: I have around 200 historical data points(ex: lots vs. rejects), how to establish better control limits as per statistics for the rejects% ? {right now no limits available for the same}
It was very helpful. Thank you!
how do you get the P value from the TValue 1.5 w/ out a calculator. 0.086002,
Is there any different between t-test and t-score ??o.0 thanks
Letting you know that the sound quality is much better in this video than z test video.
Can you please please spend sometime working on this video again but using the t-table instead of the online calculator? I think some % confidence interval must be specified in order to use the table.
I'm curious why you didn't factor in degree of freedom in your calculations. Didn't that inflate your t-score?
How did u get 1.5 ? And how to calculate it, could u show me how ?
Why didnt you at least show the area using both methods: the table and calculator.. how did u get this value ??? 0.086 from the table? any link?
Very helpful thank you.
can you not be lazy and actually use the t-table? We don't have access to t-calculators on exams
+Ali Reda Darouiche Yeah, kind of a bummer.
+Ali Reda Darouiche : no you shouldn't be lazy yourself, douche. He got you the t-score, all you have to do is follow the 8 df until you get 1.5. Obviously, the usual t-table wasn't created with thick heads like you in the mind. Now, if you follow the 8 df in the t-table, you will see that the probability of obtaining that amount is around 5-10% for one tail test (remember, sample mean greater than 80). Hence, 8.6% is between them ....he instead gave you the exact probability of scoring above 80.
+Ambassador Teklemichael Negash Why's it 5-10%?
+Ambassador Teklemichael Negash Oh nevermind! Got it, thanks for explaining
why are we forced to use the t- scores when we can get the standard deviation of the population? S = St.D of population/ (root(n) )
We find a t score when we are given a little s (standard deviation of a sample) rather than lowercase sigma ( standard deviation of all values in a population). Typically, we don't have a population standard deviation and are more often given a sample to work with. At least, according to my stat instructor.
very helpful to understand
How I see the T-score:
Me:yay I got 75 for my English!
T-score: ha nope! We gonna change that to 57.5
this is great thanks
Very Help !
Can you help me with a problem?
May be it needs correction 1-0.0860s value is will be the answer for t-value above 80.
Thank you!
Very helpful
thank you.
tell your students to pull out your calculator you had well they don't have it. it is a golden rule in math never use a calculator if your not teaching you students that then why are you in the education system your students will suffer in the long run they will make more mistakes when well if my employees can't do the math short hand then why am i hiring them
thanks men :)
Thank you..
Bless you!
how is it possible to know the average of the population but not know the standard deviation of the population?
Awsome :)
I was following until you used the t-test calculator...
I hate how you used the calculator. That doesn't show us how you arrived at the p value!!!
best one
Ok, good.
OWWWMM NW I GET IT
sample size has to be more than 30!!
Hoi