Statistics - Free Formula Sheet: bit.ly/47zjTVT Final Exams and Video Playlists: www.video-tutor.net/ Next Video: th-cam.com/video/VHYOuWu9jQI/w-d-xo.html
Mastering statistical techniques can enhance decision-making in business, healthcare, and many other areas. Explore and apply it to create value for yourself and your community!📊📊
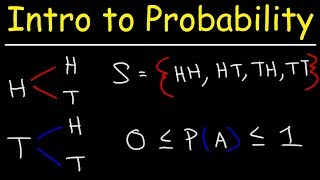
0:00 Mean = Sum/N, The Total of The Numbers Added up/How many numbers you are working with. 1:47 Median = Middle Number. 2:20 Mode = The Most Frequent number to appear in the set of numbers. 6:40 Range = Highest/Maximum Number subtracted by the Lowest/Minimum Number. 7:45 Quartiles = 25%, 50%, 75%, 100%; the 4 quarters.
🎯 Key Takeaways for quick navigation: 00:43 📊 *Mean is calculated by summing the numbers and dividing by the count. In this example, mean is approximately 15.43.* 01:52 📏 *Median is the middle number of a dataset. Eliminate the first and last numbers, then move towards the middle. In this case, median is 14.* 02:32 📊 *Mode is the most frequently occurring number. In this case, mode is 7 as it appears twice.* 02:50 📏 *Range is the difference between the highest and lowest numbers. In this example, range is 25 (32 - 7).* 04:13 📊 *For a new dataset, mean is calculated similarly. In this case, mean is 32.25.* 05:34 📏 *When finding the median for an even dataset, average the two middle numbers. Here, median is 29 for the second dataset.* 06:22 📊 *In a bimodal dataset, there are two modes. Example: 15 and 59 are both modes.* 08:44 📏 *Quartiles (Q1, Q2, Q3) split a dataset into four parts. Q2 is the median, while Q1 and Q3 are medians of the lower and upper halves.* 09:29 📊 *Interquartile range (IQR) is the difference between Q3 and Q1. Useful for identifying outliers.* 14:54 📏 *Identify outliers by checking if a number is outside the range (Q1 - 1.5 * IQR to Q3 + 1.5 * IQR).* 19:32 📏 *Construct a box and whisker plot using Q1, Q2, Q3, minimum, maximum, and outliers if any.* 22:26 📊 *Determine if a point is an outlier based on its position relative to Q1, Q3, and 1.5 times the IQR.* 26:54 📏 *Skewness to the right (positive skew) has a longer tail on the right. Mean is greater than median.* 30:04 📏 *Skewness to the left (negative skew) has a longer tail on the left. Mean is less than median.* 31:40 📊 *Dot plots visually represent the distribution of data points in a dataset.* 32:23 📊 *To construct a dot plot, create a number line and place dots above corresponding numbers in the dataset.* 33:29 📈 *The mode in a dot plot is the number with the most dots; in this case, the mode is 3.* 34:18 🌱 *To make a stem-and-leaf plot, organize the data with stems (left) and leaves (right), representing each number.* 38:51 📊 *A frequency table shows the occurrence of each number in a dataset.* 41:49 🧮 *Calculate the mean using a frequency table by summing (value * frequency) and dividing by the total number of data points.* 42:20 📊 *Histograms visualize data distribution, with connected bars; different from bar graphs.* 45:55 📊 *Create a histogram by categorizing data into classes and representing frequencies in each class with connected bars.* 50:52 📊 *A cumulative relative frequency table helps find percentiles; 60th percentile is the average of 5 and 6 (5.5).* 52:14 📊 *To find the 80th percentile, average the values where the cumulative relative frequency crosses 0.80 (7.5).* 52:43 📊 *If a percentile falls between two values, average those two values to determine the corresponding data point.* Made with HARPA AI
shouldn't the median be 23? they asked for the median of the data set, he basically rearranged the data set, making his own data set but the question asked for the original data set
By only watching the intro once, I could replicate this the whole thing on my own. Considering I am an average dude, I find it amazing, and the only explanation -you are a remarkable teacher.
New Subscriber from Philippines. Statistic subject is what I got in my college days during 2005-2010. Now, I need to recall them for MBA course. Thanks for creating this channel.
I'm 28, I love Math but I never understood it during my school days which made me believe I'm not really good at Math and not smart enough for it. But I'm giving it a try again at my age, I want to be good at it, thanks for your videos!
The entire interent is a big giant library, don't forget to add your learnings to the internet back so that others can benefit from it just the way you did
So glad I subscribed to the membership. This cleared up a lot of confusion. I have 3 weeks left of my stats class, and I really need to make sure I pass.
REMINDER: In case you have difficulties in MATHS and/or COMPUTER PROGRAMMING units, SUBSCRIBE to the channel below for tutorials th-cam.com/channels/7wd3x6_08GNoUbLxmaC4vA.html Don't forget to COMMENT, LIKE & SHARE
Hey, just wanted to give you my feedback, i've been revising for my stats exam using your videos, and they've helped since i was really poor at the subject, sat for the exam today,and i hope i'll pass. Just wanted to say thank you
Determining the outliers through this interval which is a function of the IQR makes all senses, but the choice of the factor 1.5(IQR) as the tolerance range beyond Q1 and Q3 needs some logical justification. The underlying concept is though clear, which is setting the borderline within the distribution beyond which any score from the data set is to be characterized as an outlier. Thanks for great work and concise steps!
I watched this entire hour video and it was completely worth it! My instructor is making it sound harder than it is lol THANK YOU THANK YOU THANK YOU!!!❤
I learned so much in this video it helped me review and relearn the lessons I forgot for my entrance exams. The best one hour that I have spent learning thank you so much!❤❤
I am a Nigerian student who came into Canada for my MBA and one of the course I studied last semester was quantitative analysis As a lawyer with no math background I want to thank you because your channel was handy Finished with a B
This is the first Statistics Course I have taken and Completed this course Thank U man You are a Great Teacher.. make something Data Science or Data Analytics specially ... Great Content thank U Man God Bless U ..Amen..
REMINDER: In case you have difficulties in MATHS and/or COMPUTER PROGRAMMING units, SUBSCRIBE to the channel below for tutorials th-cam.com/channels/7wd3x6_08GNoUbLxmaC4vA.html Don't forget to COMMENT, LIKE & SHARE
PRAISING THE LORD- that I have come across your page - I am currently in college being that I have not been in school since 2012. anywho I'm currently taking a statistics class and this help to inform me on what exactly I'm walking into .
Thankyou so much . Because you taught Statistics so well. I am thinking of taking Stats as a main subject in my career . I am aspiring data scientists . And i have recently completed my graduation . I want to thankyou for teaching me so well .
Covers multiple topics? Check. Somehow relates one topic to another? Check. Timestamps? Check. Simple explanations? Check. How to use the information? Check. You've got to be kidding me. Even though I watched the whole video while also writing them in my notebook, and I also liked, and subscribed, this person deserves a grand award for the quality of this vid tbh. Thank you so much. Seriously.
for my intro stats class i dont have to know HOW to make the graphs, but understanding how they're made and what they show us compared to each other really helps. better than my math teacher fr
Wonderfully done lesson. I clicked for a general refresher, which this does well. But I wish I had this video when I originally started my stats class in high school. My teacher was TERRIBLE, both at teaching AND at statistics. Two other students and I were constantly correcting her on rather basic mistakes. Halfway through the school year, she left for a month because she was taking an intro to statistics crash course 😑...she had no business teaching an AP Stats class. But the AP calculus teacher was already spread to thin to do it. He taught pre-cal calculus and intro to number theory so he couldn't. He was the best teacher I ever had. If I had these quality videos back then, I wouldn't have grown to have a grudge against statistics. Luckily, I had an amazing professor in college who fixed that. But my intro to it was rocky at best. Keep up the great work dude!!!
I’m trying to decide which math class to take at my community college and I won’t lie, I’m trying to pick the easiest college level class (I only need one math class my major) so I think watching your video may give me an idea on whether or not I’ll like intro to statistics.
Sir thank you! thank you for taking the time to make these videos. Im addicted to them! I have a teacher who is very good at his job but because math is not my cup of tea I do not do well on keeping up with his way of teaching, but you keep things so simple and clear and I just understand it better after watching your videos! As well as I love your voice :) Thank you once again
REMINDER: In case you have difficulties in MATHS and/or COMPUTER PROGRAMMING units, SUBSCRIBE to the channel below for tutorials th-cam.com/channels/7wd3x6_08GNoUbLxmaC4vA.html Don't forget to COMMENT, LIKE & SHARE
I took statistics in college. I think for anyone who doesn’t have the money this is good, but you could simplify it. Also, it’s good to have cartoons 👍 Remember, even with an hour, you have to try and keep it interesting. Statistics is all about what you are analyzing, and I think it might be better to first come up with the situation or the issue, and then break it down after you have an overview
sir your teaching is excellent, method is very easy to understand, i request please add examples, why people need mean in their daily lives, why and where. along with that in writting research papers where it can be used, and how to interpret the statistics data and results. thank you.
You are amazing… your videos are the greatest source of knowledge…it will be really good if you can give bit theoretical knowledge before solving questions,,,like what is basic difference between bar graph and histogram etc But honestly …thank you from core of my heart
🎯 Key Takeaways for quick navigation: 00:02 Arrange *data in ascending order. Calculate mean by summing and dividing by the number of data points. Mean for dataset (7, 7, 10, 14, 15, 23, 32) is approximately 15.43. Median is the middle number, so eliminate first and last, then middle two, resulting in median 14. Mode is the most frequent number; here, 7 is the mode. Range is the difference between the highest and lowest numbers, so it's 32 - 7 = 25.* 03:19 Similar *problem with eight numbers (11, 15, 21, 37, 41, 59), calculating mean (32.25), median (29 as there are two middle numbers), mode (15 and 59, bimodal), and range (59 - 11 = 48).* 07:05 Introduction *to quartiles (Q1, Q2, Q3) and interquartile range (IQR). Q2 is the median, Q1 is the median of the lower half, Q3 is the median of the upper half. IQR is the difference between Q3 and Q1. Outliers are identified if outside the range of Q1 - 1.5*IQR to Q3 + 1.5*IQR.* 10:25 Example: *Identifying Q1, Q2, Q3, calculating IQR, and checking for outliers (27 is not an outlier). Construction of a box and whisker plot using the obtained values.* 17:47 Another *example data set (13, 16, 18, 22, 23, 25, 28, 29, 31, 38, 50). Calculating Q1, Q2, Q3, IQR, identifying the outlier (50), and constructing a box and whisker plot.* 26:22 Explanation *of skewness in data distribution. A symmetrical distribution has mean = median; skew to the right means mean > median; skew to the left means mean < median. Visualization of skewness using box plots.* 31:53 Dot *plot creation for data set (5, 8, 3, 7, 1, 5, 3, 2, 3, 8, 5). Mode is the number with the most dots, so mode is 3.* 33:59 Introduction *to stem and leaf plots. Example data set (4, 9, 13, 13, 17, 21, 36, 38, 38, 56) demonstrated in stem and leaf plot form.* 34:32 Stem-and-leaf *plots involve organizing data into stems and leaves, helping visualize distribution.* 38:36 Frequency *tables are used to organize data and display the frequency of each value, aiding in understanding data distribution.* 42:04 Histograms *visually represent the distribution of a data set, with bars connected to show the relationship between values.* 47:26 Creating *a table with frequency, relative frequency, and cumulative relative frequency provides a comprehensive view of data distribution.* 51:23 Percentiles *can be determined using cumulative relative frequency tables, aiding in understanding data distribution and identifying specific percentiles.* Made with HARPA AI


Statistics - Free Formula Sheet: bit.ly/47zjTVT
Final Exams and Video Playlists: www.video-tutor.net/
Next Video: th-cam.com/video/VHYOuWu9jQI/w-d-xo.html
Mastering statistical techniques can enhance decision-making in business, healthcare, and many other areas. Explore and apply it to create value for yourself and your community!📊📊
You literally teach our entire generation with your videos
yea lol
i am not even in school i am learning stats
I come from Afghanistan and study in Bocconi university of Italy. This channel helped me alot in math to be successful. Thank you.
@@JOHN-dr3st educational rizz 💀🙏🏼
@@hle6391 lol what?
@@geekblob idk shit was funny 3 months ago
@@hle6391 damn, lol. It's been 3 months as you said, so have you completed the statistics course yet?
@@geekblob yep. We have several courses in math that give us our final grade. Statistics is easy
I've been out of high-school for ages and I'm going back to college for the first time in 14 years. These videos are so helpful.
Hope your room mate isn’t the booty warrior
@@dajoker8998 y would this even be a thought 😭is that what happened with your roommates?
@@boot5672 no
@@boot5672 but it’s college
@@boot5672 look out ladies
0:00
Mean = Sum/N, The Total of The Numbers Added up/How many numbers you are working with.
1:47 Median = Middle Number.
2:20 Mode = The Most Frequent number to appear in the set of numbers.
6:40 Range = Highest/Maximum Number subtracted by the Lowest/Minimum Number.
7:45 Quartiles = 25%, 50%, 75%, 100%; the 4 quarters.
I Wish in my school it was enough to pass the exam
@@Viilapyou need this info too pass
Omg I love you
youre a true legend❤
Thank You!!
🎯 Key Takeaways for quick navigation:
00:43 📊 *Mean is calculated by summing the numbers and dividing by the count. In this example, mean is approximately 15.43.*
01:52 📏 *Median is the middle number of a dataset. Eliminate the first and last numbers, then move towards the middle. In this case, median is 14.*
02:32 📊 *Mode is the most frequently occurring number. In this case, mode is 7 as it appears twice.*
02:50 📏 *Range is the difference between the highest and lowest numbers. In this example, range is 25 (32 - 7).*
04:13 📊 *For a new dataset, mean is calculated similarly. In this case, mean is 32.25.*
05:34 📏 *When finding the median for an even dataset, average the two middle numbers. Here, median is 29 for the second dataset.*
06:22 📊 *In a bimodal dataset, there are two modes. Example: 15 and 59 are both modes.*
08:44 📏 *Quartiles (Q1, Q2, Q3) split a dataset into four parts. Q2 is the median, while Q1 and Q3 are medians of the lower and upper halves.*
09:29 📊 *Interquartile range (IQR) is the difference between Q3 and Q1. Useful for identifying outliers.*
14:54 📏 *Identify outliers by checking if a number is outside the range (Q1 - 1.5 * IQR to Q3 + 1.5 * IQR).*
19:32 📏 *Construct a box and whisker plot using Q1, Q2, Q3, minimum, maximum, and outliers if any.*
22:26 📊 *Determine if a point is an outlier based on its position relative to Q1, Q3, and 1.5 times the IQR.*
26:54 📏 *Skewness to the right (positive skew) has a longer tail on the right. Mean is greater than median.*
30:04 📏 *Skewness to the left (negative skew) has a longer tail on the left. Mean is less than median.*
31:40 📊 *Dot plots visually represent the distribution of data points in a dataset.*
32:23 📊 *To construct a dot plot, create a number line and place dots above corresponding numbers in the dataset.*
33:29 📈 *The mode in a dot plot is the number with the most dots; in this case, the mode is 3.*
34:18 🌱 *To make a stem-and-leaf plot, organize the data with stems (left) and leaves (right), representing each number.*
38:51 📊 *A frequency table shows the occurrence of each number in a dataset.*
41:49 🧮 *Calculate the mean using a frequency table by summing (value * frequency) and dividing by the total number of data points.*
42:20 📊 *Histograms visualize data distribution, with connected bars; different from bar graphs.*
45:55 📊 *Create a histogram by categorizing data into classes and representing frequencies in each class with connected bars.*
50:52 📊 *A cumulative relative frequency table helps find percentiles; 60th percentile is the average of 5 and 6 (5.5).*
52:14 📊 *To find the 80th percentile, average the values where the cumulative relative frequency crosses 0.80 (7.5).*
52:43 📊 *If a percentile falls between two values, average those two values to determine the corresponding data point.*
Made with HARPA AI
Thanks alot
MAN! you are incredible!!!!
nice
ILY. Also love how you give credits to the program you used. This comment deserves a like
shouldn't the median be 23? they asked for the median of the data set, he basically rearranged the data set, making his own data set but the question asked for the original data set
Im in high school, i NEEDED that so bad. Math is hard fr
lol i watched 10 of his videos in 2 days for an exam
Bro just says 'solve this' but proceeds to solve it for us so we can learn. Goated🗣️🔥🔥🔥🗿
By only watching the intro once, I could replicate this the whole thing on my own. Considering I am an average dude, I find it amazing, and the only explanation -you are a remarkable teacher.
I will never stop to wonder who this guy is. He knows all subjects in the entire world. How is that even possible?
Walai anajua kila kitu hadi ananistua😂
@@faithwangui7200 you learn in which school btw?
you're by far the best mathematics teacher i have ever come across.
you have single-handedly helped me pass calculus and statistics. I can't thank you enough
New Subscriber from Philippines. Statistic subject is what I got in my college days during 2005-2010. Now, I need to recall them for MBA course. Thanks for creating this channel.
I watch the whole video, I love it
I'm 28, I love Math but I never understood it during my school days which made me believe I'm not really good at Math and not smart enough for it. But I'm giving it a try again at my age, I want to be good at it, thanks for your videos!
Due to my economical situation I couldn't buy courses or subscribe to membership but I am truely grateful to subscribe your channel.
The entire interent is a big giant library, don't forget to add your learnings to the internet back so that others can benefit from it just the way you did
It looks like great!
So glad I subscribed to the membership. This cleared up a lot of confusion. I have 3 weeks left of my stats class, and I really need to make sure I pass.
(The final exam)
@@michellemichelle5202 how much do u pay? which tier subscriber are u?
@@talhaabbas4334 I only saw one tier… I’m not sure, I would have to check
REMINDER: In case you have difficulties in MATHS and/or COMPUTER PROGRAMMING units, SUBSCRIBE to the channel below for tutorials
th-cam.com/channels/7wd3x6_08GNoUbLxmaC4vA.html
Don't forget to COMMENT, LIKE & SHARE
Exactly where I'm at rn. He is the only one I can understand & retain information from!
literally left my live online classes and came here
Sameer
7 weeks into the semester and this is the first time i actually understand statistics. thank you
Hey, just wanted to give you my feedback, i've been revising for my stats exam using your videos, and they've helped since i was really poor at the subject, sat for the exam today,and i hope i'll pass. Just wanted to say thank you
did you pass the exam bro
Determining the outliers through this interval which is a function of the IQR makes all senses, but the choice of the factor 1.5(IQR) as the tolerance range beyond Q1 and Q3 needs some logical justification. The underlying concept is though clear, which is setting the borderline within the distribution beyond which any score from the data set is to be characterized as an outlier. Thanks for great work and concise steps!
I watched this entire hour video and it was completely worth it! My instructor is making it sound harder than it is lol THANK YOU THANK YOU THANK YOU!!!❤
You are indeed serving humanity. So well done. God bless you abundantly, you will never lack.
This is the best Lecturer on statistics i have had in a life time
I learned so much in this video it helped me review and relearn the lessons I forgot for my entrance exams. The best one hour that I have spent learning thank you so much!❤❤
If I become someone big in the future then ill personally make sure the entire world knows about your greatness
I had not understood what my uni teacher said until I found you. Thanks a lot.
I learned more from you in a few minutes than in college. Thank you so much for presenting excellent videos.
i thought i was gonna fail life until I found this channel
Hi statistics help,for your assignments
This video will not go viral but it will help more generation to be successful in their career. What i mean Is thank-you for making this video.
I am a Nigerian student who came into Canada for my MBA and one of the course I studied last semester was quantitative analysis
As a lawyer with no math background I want to thank you because your channel was handy
Finished with a B
sadd, i was looking for the nigerian prince
This is the first Statistics Course I have taken and Completed this course Thank U man You are a Great Teacher.. make something Data Science or Data Analytics specially ... Great Content thank U Man God Bless U ..Amen..
REMINDER: In case you have difficulties in MATHS and/or COMPUTER PROGRAMMING units, SUBSCRIBE to the channel below for tutorials
th-cam.com/channels/7wd3x6_08GNoUbLxmaC4vA.html
Don't forget to COMMENT, LIKE & SHARE
Protect this man at all cost.
I watched this playlist from 0 to 79 and I can tell that the content is clear and well explained in details. Thank you . And keep it up.
PRAISING THE LORD- that I have come across your page - I am currently in college being that I have not been in school since 2012. anywho I'm currently taking a statistics class and this help to inform me on what exactly I'm walking into .
You saved my grade . THANK YOU SIR
Thankyou so much . Because you taught Statistics so well. I am thinking of taking Stats as a main subject in my career . I am aspiring data scientists . And i have recently completed my graduation . I want to thankyou for teaching me so well .
hello sir do you need help with your classes or exam at affordable prices
Thank you so much for your contribution- simple and effective! You are building a great future!
You videos are the best on the web. You are a genius!
Mean(X_) median(M) mode range quartile inter-quartile range(IQR), outlier, box and whisker plot, skewer (right/positive/X_>M left/negative/X_
This is one of the most useful videos on TH-cam. Thank you for making these! You also sound like Mark Walburg so it makes it even more fun haha!
Haven’t been in lectures past ten weeks, these vids boutta clutch it all up
me too
i hope you get so much health and wealth and happiness i hate math and anything related to it but your channel saved me
Covers multiple topics? Check.
Somehow relates one topic to another? Check.
Timestamps? Check.
Simple explanations? Check.
How to use the information? Check.
You've got to be kidding me. Even though I watched the whole video while also writing them in my notebook, and I also liked, and subscribed, this person deserves a grand award for the quality of this vid tbh.
Thank you so much. Seriously.
thanks. taking a stat course next semester and this is really helpful
for my intro stats class i dont have to know HOW to make the graphs, but understanding how they're made and what they show us compared to each other really helps. better than my math teacher fr
Wonderfully done lesson. I clicked for a general refresher, which this does well. But I wish I had this video when I originally started my stats class in high school.
My teacher was TERRIBLE, both at teaching AND at statistics. Two other students and I were constantly correcting her on rather basic mistakes. Halfway through the school year, she left for a month because she was taking an intro to statistics crash course 😑...she had no business teaching an AP Stats class. But the AP calculus teacher was already spread to thin to do it. He taught pre-cal calculus and intro to number theory so he couldn't. He was the best teacher I ever had.
If I had these quality videos back then, I wouldn't have grown to have a grudge against statistics. Luckily, I had an amazing professor in college who fixed that. But my intro to it was rocky at best.
Keep up the great work dude!!!
Perfect timing of this video! Thank you for uploading
Watching this on night just few hrs b4 my math mock exam
Sir, you're an exceptional teacher.
I just watched and took notes on everything step by step, wow! Thank you!
Bro your teaching style way more better and effective than my teacher.
I’m trying to decide which math class to take at my community college and I won’t lie, I’m trying to pick the easiest college level class (I only need one math class my major) so I think watching your video may give me an idea on whether or not I’ll like intro to statistics.
Thanks for this video. I love your calm style of teaching!!
I genually love this man no joke😭
you're been a great help, all my professor does in class is talk about his wife its actually crazy
Always the best content to learn in every subject. Thank you for your videos!
Thank you. It was very help full to understand basics easily by spending less time❤❤❤❤
Thank you, thank you, thank you! Perfectly explained, much better than my current Stats professor.
This channel is very helpful due to your simple explanation of the issue of statistics. Thank you!
Thanks ,I could rebruch all my old data
That is the best statistics playlist ever.
this is the best way to understand statistics thankyou so much bless you!
thank you so much you have just yet again saved me from disownership
Sir thank you! thank you for taking the time to make these videos. Im addicted to them! I have a teacher who is very good at his job but because math is not my cup of tea I do not do well on keeping up with his way of teaching, but you keep things so simple and clear and I just understand it better after watching your videos! As well as I love your voice :) Thank you once again
REMINDER: In case you have difficulties in MATHS and/or COMPUTER PROGRAMMING units, SUBSCRIBE to the channel below for tutorials
th-cam.com/channels/7wd3x6_08GNoUbLxmaC4vA.html
Don't forget to COMMENT, LIKE & SHARE
missed tons of my stat lectures. even tho this vid's content is far from my material, felt quite glad after watching it
I like to call the mode as the most popular number just a nice way to remember
nice, im having statistics this semester, hope u have more statistics coming
hello sir do you need help with your classes or exam at affordable prices
I'm gonna start downloading a couple of these videos for when I have a child, I can show him this.
I owe you a lot for the knowledge,Sir. ALLAH bless you!
Your videos are the best!!
It always help me to revise old and important concepts..
This video is very helpful for beginner. From Jahangirnagar University, Bangladesh.
The best math tutor on the internet:)
well explained . more useful than many teachers content .
As a college student who doesn’t understand the stat her professors is teaching, I thank you greatly
Thank so much for the video it has helped alot ,I was not keen to watch it at first as it was very long but it was worth watching🙏
1:18 Blackboard space awareness is at top level!
Thank You so much! your teaching style is very clear and on point! Great Job!
I took statistics in college.
I think for anyone who doesn’t have the money this is good, but you could simplify it.
Also, it’s good to have cartoons 👍
Remember, even with an hour, you have to try and keep it interesting.
Statistics is all about what you are analyzing, and I think it might be better to first come up with the situation or the issue, and then break it down after you have an overview
sir your teaching is excellent, method is very easy to understand, i request please add examples, why people need mean in their daily lives, why and where. along with that in writting research papers where it can be used, and how to interpret the statistics data and results. thank you.
You are amazing… your videos are the greatest source of knowledge…it will be really good if you can give bit theoretical knowledge before solving questions,,,like what is basic difference between bar graph and histogram etc
But honestly …thank you from core of my heart
Thank you for this, you did a phenomenal Job, God Bless your Soul!
Dude is actually single-handedly carrying the weight of the mathematical education of millions
Sir I don't even know this course but you're teachings really made me understand the subject to the best of my abilities. Thank you professor.
You're a great teacher! Also your voice is perfect!
idk if i too dumb in math or what, but this introduction feels too heavy for me.
but dude, this is wonderful 🙏
🎯 Key Takeaways for quick navigation:
00:02 Arrange *data in ascending order. Calculate mean by summing and dividing by the number of data points. Mean for dataset (7, 7, 10, 14, 15, 23, 32) is approximately 15.43. Median is the middle number, so eliminate first and last, then middle two, resulting in median 14. Mode is the most frequent number; here, 7 is the mode. Range is the difference between the highest and lowest numbers, so it's 32 - 7 = 25.*
03:19 Similar *problem with eight numbers (11, 15, 21, 37, 41, 59), calculating mean (32.25), median (29 as there are two middle numbers), mode (15 and 59, bimodal), and range (59 - 11 = 48).*
07:05 Introduction *to quartiles (Q1, Q2, Q3) and interquartile range (IQR). Q2 is the median, Q1 is the median of the lower half, Q3 is the median of the upper half. IQR is the difference between Q3 and Q1. Outliers are identified if outside the range of Q1 - 1.5*IQR to Q3 + 1.5*IQR.*
10:25 Example: *Identifying Q1, Q2, Q3, calculating IQR, and checking for outliers (27 is not an outlier). Construction of a box and whisker plot using the obtained values.*
17:47 Another *example data set (13, 16, 18, 22, 23, 25, 28, 29, 31, 38, 50). Calculating Q1, Q2, Q3, IQR, identifying the outlier (50), and constructing a box and whisker plot.*
26:22 Explanation *of skewness in data distribution. A symmetrical distribution has mean = median; skew to the right means mean > median; skew to the left means mean < median. Visualization of skewness using box plots.*
31:53 Dot *plot creation for data set (5, 8, 3, 7, 1, 5, 3, 2, 3, 8, 5). Mode is the number with the most dots, so mode is 3.*
33:59 Introduction *to stem and leaf plots. Example data set (4, 9, 13, 13, 17, 21, 36, 38, 38, 56) demonstrated in stem and leaf plot form.*
34:32 Stem-and-leaf *plots involve organizing data into stems and leaves, helping visualize distribution.*
38:36 Frequency *tables are used to organize data and display the frequency of each value, aiding in understanding data distribution.*
42:04 Histograms *visually represent the distribution of a data set, with bars connected to show the relationship between values.*
47:26 Creating *a table with frequency, relative frequency, and cumulative relative frequency provides a comprehensive view of data distribution.*
51:23 Percentiles *can be determined using cumulative relative frequency tables, aiding in understanding data distribution and identifying specific percentiles.*
Made with HARPA AI
Thank you so much for your effort in bringing us good videos that we can understand, your video's really help me.
I pass first year because of you, now I'm back to pass second year😂😚💛💛💛I love you so much teacherr💗
Crystal Clear bro....💎
You’re so good at what you do!👏🏾
This is a wonderful introduction. Neatly done. Thank you very much. Great job
Anyone else watching this right before finals?
do you have a video on random, systematic, convenience, stratified, clustered?
thank you for doing these videos it helped me ALOT with my algebra Eoc!
Thanks for the really easy to get explanation !
Really informative channel! Thank you for sharing. I will be back to view more
Thank you.
Thanks for your videos I understand Statistics better.
My life will never be the same I have learnt
When he earns the desired out of a premium video then he makes sure to post that to the general audience. Based on my guess.