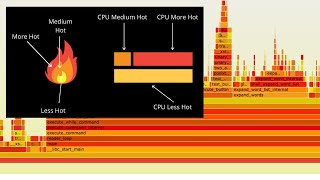
@22:30 imagine time as the dimension coming towards you a 3D render would show the change in shape over time and visualize usage history from the 3D top surface. Prioritize optimization by volume in this space.
@ 19:55 the interpretation section seems like a good complement to the code reading techniques described in The Programmer's brain, by Dr Felienne Hermans.


Brendan Gregg is the best!
@22:30 imagine time as the dimension coming towards you a 3D render would show the change in shape over time and visualize usage history from the 3D top surface. Prioritize optimization by volume in this space.
@ 19:55 the interpretation section seems like a good complement to the code reading techniques described in The Programmer's brain, by Dr Felienne Hermans.
Dead audience, you killed it