R - Multilevel Models Lecture (Updated)

ฝัง
- เผยแพร่เมื่อ 5 มิ.ย. 2024
- Lecturer: Dr. Erin M. Buchanan
Missouri State University
Spring 2017
This video is a rerecording of a multilevel model lecture I gave a while back - covers the ideas behind MLM and how to run a model in R using nlme. The example is new!
Lecture materials and assignment available at statisticsofdoom.com.
statisticsofdoom.com/page/adv...


I thank you from the bottom of my heart for such clear and insightful lecture. Wish I could have a stat teacher like you! Everything make sense in your lectures. Thank you for all your efforts :)
The first half of this video is excellent and clearly guides you through Andy Field Discovering Statistics with R Chapter 19 Multilevel Linear Models. Thank you for doing this.
I got lost the next half 😀
This is one of the best videos that I've found on this topic; thank you *so much* for what you do.
Thanks for the kind words!
Thank you for making this public! Such a useful lecturer..
Thanks! :)
best lecturer ever seen
Thank you!
Great video! Thank you so much
Thanks from Brazil. Such a good lecture
Thank you!
You are awesome, thank you very much!
Hello, this is really a good lecture.
A suggestion for a future course is one where you include different correlation structures in the random effects. I think that would be nice, as well as including non-normal outcome variables. I'd love a lecture including these topics.
Thank you!
Great suggestion - will incorporate in newer lectures.
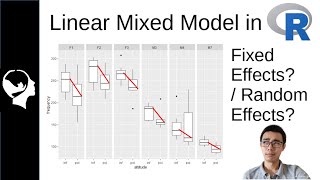
Thanks, for this video and all the time you put into this very important subject. As I was thinking about the heterostatisity time problem you observed toward the end, would the fact that participants usually learn to “pace” themselves for tests be a primary reason for the fan effect in the graph?
Maybe! I think there could be a few reasons - repeated measures data is hard to tell sometimes without having more variables to test if that's the cause of the heterogeneity.
Hi Erin,
Thanks so much for this video, which is incredibly helpful! I'm wondering whether there's a better option for dealing with missing data in lme (or any related package like lme4) than na.omit? Basically, I'm looking for something akin to what MPLUS does with its ML estimator, where all cases that have some data are retained in the analysis. I'd prefer not to go the multiple imputation route, if possible. Thanks in advance!
Good question - no not really that aren't multiple imputation. I mean lme will estimate the ones that make sense (i.e. if you have time 1 and 3, you'll get an idea of what two might have been like). There might even be something hidden in nlme that I'm not aware of.
Thanks for this helpful tutorial!
Dr. Buchanan, thank you so much for this lecture, it's going to be so helpful for me when it comes it comes to my analysis! I just wondered your thoughts on using JASP to conduct multilevel models? It's a more user-friendly interface, but not sure it would allow for all the possible analysis options that R has?
I've just realized that JASP added a MLM module. I haven't looked into it at all. I'm sure they did a great job implementing, but I'd probably vote for having more control over the analysis (I also feel this way about their SEM modules).
Thank you so much for the video! Very helpful. I was wondering, in your example it seems that "response" is a continuous variable. However, many times participants are nested within a categorical variable such a "time 1", "time 2" and "time 3". Would you go about it the same way? And would the residuals be plotted for homoscedasticity in the same manner?
Here the nesting is within trial code - the response is the DV we are interested in. So, I would nest by time if you were interested in controlling for it that way.
@@StatisticsofDOOM Thanks! I guess I misunderstood this part. I think I'll watch it again!
This is such a helpful video. Thank you so much. Some of the R syntax is cut out in the video. Is there a way to access the full R script?
Yep - everything should be here: github.com/doomlab/statsofdoom-files/tree/master/advanced/R/Other%20Files
Thank you so much for this! Been struggling to find assumption checks for awhile. I had a question though when creating the random data why did you use a df = 7? and is there a way to test multicollinearity on the long data format instead of wide?
You can use any number greater than 2 really - just need enough variance in the chi-square distribution to get "randomness". 7 is just the number I picked a million years ago. And correlation wise...not really? I think you might be able to get the correlations out of the actual MLM part that could work pretty well (it shows when running lme with nlme package).
Thanks! You wouldn't happen to know to do any of these assumption tests in lmer instead of lme?
I believe you could do it approximately the same way - I haven't used lmer much, but the hard part would be getting the residuals out I would think. Looks like you can use resid(saved-model-fit) to get them. Additionally plot(saved-model-fit) will give you some diagnostic plots.
Thank you for the great tutorial! I have a question though: Does it work the same way with a binary/dichotomous dependent variable? And if not: How would it be conducted differently? I would very much appreciate an answer!
The concepts are the same but the code is not - you should use a glmer() model, so you can use a logistic regression. You can check out one of our papers that used this type of code osf.io/ex7js/ - we didn't do all the nested model testing, but you could. Notice the random effects are listed as (1|Variable) rather than in a special random argument.
@@StatisticsofDOOM I had the same question but I think this link doesn't work anymore.
@@ahmetaltnok3572 Unfortunately, the autoformatting on youtube included the ) - the link is osf.io/ex7js/
Hi, thanks a lot for the precise explanation. Could you make give a lecture on random parameter NB and random parameter logit model in R? Thanks in advance.
I’ll add it to the list! Bit swamped right now unfortunately 😖
Hello, thank you for this lecture!
I have a question though.. If the data had been from a survey that was stratified by region, and then PSUs were cities and SSUs were households, is it correct to include a random effect for region? I have weights for the level-1 and level-2 sampling stages, but I am unsure if I can include region which is not nested within my PSUs (it's the other way around).
Sure! You can control for that random effect as well. It would be another random intercept instead of a set of nested random intercepts like list(1|variable, 1|variable) rather than 1|var/var.
Dear Dr. B. I have a question. You show us the likelihood test to compare the fixed vs. random intercept model, but I've also learned elsewhere that ICC and significance of the variance between individuals demonstrates the need for random intercepts. Are these two tests equivalent in this case?
Thank you for all your content, you are awesome :) I'm currently a PhD student and your content is certainly helpful.
Yes, I've heard you can do that as well. I don't know if they are equivalent in the sense that they will always give you the same answer, but they are likely good options to demonstrate the need to control for correlated error. I often will still use random intercept even if it's not significant just because it seems odd to NOT control for participant correlated error when using repeated measures designs.
Thank you Dr. B. Much love from another MSU (Michigan State).
hi there i am a phd student do you master multilevel model
Thanks for this video. Very helpful! :) Regarding centering of variables to combat multicolinearity, I don't think that it would do anything to combat the problem since cov(X - c, Y - k) = cov(X, Y) for any constants c and k. The means of X and Y are constants, so subtracting the mean from each variable doesn't change the covariance. But perhaps I misunderstood? Does such a centering help algorithms converge, despite not affecting the covariance?
You are correct, and I believe it's mostly to help with interpretation of the slopes as well (i.e., mean centering allows you to know that the main regression is the average level for slopes).
Statistics of DOOM Thank you for your reply, Professor. I much appreciate it. I am not quite sure that I follow your answer though. The average of random effects are zero both when centering and not centering variables. In both case the random effects are spread around the fixed effect, and do so with mean zero. So whether or not centering is done, shouldn't the interpretation be the same for the slopes? (Given that they are centered around the grand mean, that is, and not around subject level means.)
Oh right, I was talking about the fixed effect interpretation not the random effects - sorry about that! You are correct.
Thanks for a great lecture.
Any guideline for using multilevel modeling for logistic regression?
Actually have done a bunch of these recently but have not made a video of them. You can extend the use mlm to log using the lme4 package the glmer() function:
glmer(DV ~ IV + (1|part_no),
data = data,
family = binomial(),
control = glmerControl(optimizer = "bobyqa"),
nAGQ = 1)
The family/linking function converts it to log regression.
No to machine learning, as that's not my area.
Hi,
I really appreciate your guidance.Thanks for that.
I am dealing with an insurance company. I have to predict when a policy will lapse (or churn) based on the details that are sitting at lower levels (at individual clients in a policy, and then at different covers (riders) that each client might have).
So there are three levels in total, which are a Policy, a Client, and a Cover level. In most MLM examples that I have seen, the highest level groups usually have many observations e.g. students in classrooms or workers in work groups. Here, if I say, each Policy is a group then there are usually less than 10 observations in each group. Is this OK to think a policy as the highest level group? Especially we want to predict whether a policy will lapse or not.
Please see the picture of the data sample here: pin.it/5ksmOdj
Kind Regards,
Umair
Yes, I believe it would be ok to group by that factor - if it doesn't run then you could try a different combination.
Can one reason for using MLM in repeated measures analysis is when you have a continuous predictor for those repeated measures? In my case, I have a continuous predictor and participants are viewing repeated stimuli. I don't want to use an ancova because I am not interested in controlling that continuous predictor, and I do not want to factor the continuous variable to fit an anova model. Thanks for your help!
Yes! That's a good reason as well :) then you are using regression and controlling for correlated error.
Cheers for that content! downloaded the code to play around with it on my own. I m just wondering who you use the gls() model as model 1, instead of a standard lm(). U said that s because the data is not "stacked" or "nested", but that doesnt make much sense for me (as of now). Thanks again for your effort!
The intercept only model does not control for the repeated measures component, so you can use lm() or gls() - I just happen to like gls() in this case.
Especially because of the correlated error terms - check this out: socialsciences.mcmaster.ca/jfox/Books/Companion/appendices/Appendix-Timeseries-Regression.pdf
Quick reply right there :D got it thanks
Dr. Erin M. Buchanan, thanks a lot for this video. I have questions about sample size for multilevel modeling. I noticed that a paper have 206 students nested within 47 classrooms, i.e., 4 or 5 students for each classroom, they used multilevel modeling, but I wonder whether multilevel modeling can be used for this small sample at individual level; I also have a nested dateset, 10 schools and 3-19 students for each school, 128 students in total, can I use multilevel modeling for my data? if not due to small sample size, whether there will be a problem for standards errors estimate when considering schools and students at the same level using linear models. I look forward for your reply! thanks!
I tried an interception model using school number as a level 2 variable, the ICC of this model is 0.16, indicating somehow similarity within a school, but I am not sure whether my small sample sizes at both level 2 and level 1 are suitable for multilevel modeling
Yes! You just need N > 1 observations in the nesting variables.
How would you go about calculating effects sizes? I have the problem where my data set is huge and so everything is significant.
The short answer is there isn't a good answer? There's a couple new papers that talk about this idea: largescaleassessmentsineducation.springeropen.com/articles/10.1186/s40536-018-0061-2
www.google.com/url?sa=t&rct=j&q=&esrc=s&source=web&cd=2&cad=rja&uact=8&ved=2ahUKEwjj9Zrko6feAhVmtIMKHRm9BlgQFjABegQICBAC&url=http%3A%2F%2Fwww.psy.mq.edu.au%2Fpsystat%2Fdocuments%2Fstandardised_effect_size_in_mixed_ML_models.pdf&usg=AOvVaw3y89_kkv8uLxjPovhv11uv is another one.
Hi - Great video. I dont understand why do u check for missing data if the model can handle missing data?did I understand something wrong?
Always good to know what’s missing where - I often catch coding errors or other issues by screening.
If I have a time varying covariate, such as a hormone that fluctuates on time 1, time2, and time 3, would there have to be an adjustment made to the lmer code to account for that within change. I want to be able to say that variation in a hormone within the individual affects their behavior.
Are you wanting time to be the random factor? Or a fixed effect? Not completely following.
@@StatisticsofDOOM I am tracking hormones throughout the menstrual cycle at three time points and interested if they affect behavior. If I want to know if within change in hormones affects behavior, would i have to include time into the model? Hope that is clear.
@@rayray0313 Ok, so if you expect some sort of linear change over time, I would put time in equation - if you expect it to be variable, I would suggest some of the level centering techniques that I see clinical people do - here's what I think is an open access article on the topic: www.ncbi.nlm.nih.gov/pmc/articles/PMC3059070/
@@StatisticsofDOOM This was very helpful. Thank you so much! Will you do any videos on multi-level modeling in JAMOVI?
@@rayray0313 ohhh! I didn't know jamovi did that - I will check it out and add it to my list.
Dear Prof. Buchanan: Thank you for providing such a great video. After watching your video, I would like to ask some questions:
(1)
Should I run any post hoc or any simple main effects analysis at the end of the multilevel analysis?
(2)
Currently, I'm using multilevel approach to analyze data of 3x3 randomized block factorial design. Again, should I do any post hoc or any simple main effect analysis? the reason why I ask this is that I tried to run post poc using paired t-test to check the pairwise comparisons, but it only show p value no t-value, so I'm not sure if its' necessary to run post hoc >
1) if you have an interaction you are interested in breaking down, you could do simple effects
2) you could run pairwise t-tests if you are only controlling for random intercepts by participant - I might suggest a simple effects analysis (split one variable into separate datasets, run the same MLM on the each dataset separately without that split variable in the equation). That would hold all things constant, in case your model gets more complex.
Just a heads up, your video cuts off about a quarter of the R code you're using...
How odd - I definitely recorded it full screen. :| the code is provided on our companion website to view though, if you need to see it completely.
@@StatisticsofDOOM No website anymore?
@@sallyletsinger3789 It's there, just need to update all the links and finish putting together the new layout: statisticsofdoom.com/page/advanced-statistics/