Your videos should be mandatory tutorial for Data Science/ ML courses in all the Universities. Students throughout the world would get benefited after watching the best ML video.Hats off to you great Josh Starmer..............
Best machine learning playlist I have encountered on the TH-cam . The animations and your funny way of teaching makes it easy to understand concepts. The amount of work you put to create these videos deserves great appreciation. I would definitely recommend to go through the videos for anyone who is reading this comment.
I have read and looked at most recommended books and videos on kernels and whilst somewhat familiar with the math, never truly understood the principles. Statquest actually makes complex topics simple, arguably one of the best if not the best teacher on youtube and definitely the best stat explanations. Thanks Josh much appreciated 👍
I want to thank you so much for all your videos. I was lost in a forest of vectors matrices and greek letters when I heard about these topics in lecture and I did not understand a thing. As I was practising for the exam, I discovered your videos and now I do actually understand what is happening. Really love the practical, example driven approach!
This is one of the best explanation for support vector machines... If anyone is interested in why dot products are integral to the idea of SVM, please refer to Professor Wilson's MIT lecture on SVM... It is another great explanation for SVM...
You are videos are simply amazing! And the level of abstraction is right at the sweet spot! Thank you for the extremely thoughtful and precise illustrations!
First of all, thanks for your explanation, after plugging two data points into polynomial kernel function a and b then get the value 16,002.25, then you said we get higher dimensional relationship. Could you elaborate further what "relationship" did you refer to based on the value 16,002.25? Sorry I was not quite sure about that
I thought the whole point of using the kernel trick was to save on the computation cost. If we are using an iterative algorithm anyway, how is that better than transforming the data?
a synonym for 'high dimension' is many features or variables. Relationship think connection(s). So if we have a high D. relationship, we have a set of many variables that are connected by some idea or mathematical formula. Does that help?
@@Actanonverba01 that's what I thought but that is irrelevant here because we only have obe variable with two possible categories of values. But of course we can add more connecfions and variables which I think is what you are alluding to
@@leif1075 It's not actually what he means and it's not irrelevant. High dimensional space means we take our original input feature space (in this case just X1) and transform it into higher dimensional space by "making up" new dimensions that are functions of our original dimensions (X1) so that the data is linearly separable in that new space. The pair wise relationships (aka similarity) are the dustances between the observations projected into that higher dimensional space (usually referred to as latent space). So it doesn't matter how many features you have in your original dataset nor how many outcome classes you have - those are irrelevant to the SVM algorithm mechanics, they only change the scale.
@@statquest this doesnt show where on esrth you dsrive that formula from..WHY do you multiply a times b and then add r .why not multiply all three or add all three..see what I mean? I don't see how anyone could figure itnout..not enough info here to derive it
Earlier i had an intuition of all Algos which was incomplete and which could not be explained to others, Concepts are getting cleared now. Thanks STATQUEST Team, Josh Starmer, will contribute ASA i get a job in DS field.
Thank you for this video! It was very helpful in terms of understanding the details of how the kernel function leads to certain equations that need to be solved to obtain the relevant Support Vector Classifier!
Thanksss Josh Starmer.I am facinated because of your videos. Please make a video about how 16002.25 is used bam?. Moreover I think that you can make video playlist about how machine learning algorithms has coded double bamm . Keep going man, we love you triple bamm!!!
@@statquest How is the relationship of 16.002,25 to be interpreted? I understood that if we transfer everything to the higher dimension we can solve it, but I did not understand the part about relationships between the points and how they help.
@@kevinarmbruster2724 We plug the relationships into an algorithm that is similar to gradient descent and it can use them to find the optimal classifier. However, the details are pretty complex and would require another video.
First of all thankyou so much for explaining with such amazing illustrations. One doubt, how can we actually use relationship between points to find the support vector classifier?
Unfortunately that's a difficult question to answer and I'd have to dedicate a whole video to it. However, the simple answer is that it uses a method like Gradient Descent to find the optimal values.
I've understood more than I ever expected to understand in this topic all thanks to your videos. But now I've stumbled a bit: How do you solve a constant like the one in 5:50? Or what does solving mean in that context now that it isn't a formula? Could you please expand on that?
Think of it as a loss value, and it is something we try to optimize with an iterative algorithm that is similar to Gradient Descent: th-cam.com/video/sDv4f4s2SB8/w-d-xo.html
I could be wrong, but I think there is a slight mistake in this video. The kernel function should be of the form (ab-1/2)^2. This is because the support vector classifier is essentially thresholding based on whether x>y or not. Let me know please if I am wrong. And, thanks for your cool videos.
Most people define it the way I defined it in the video, (ab + r)^d. For more details, see: en.wikipedia.org/wiki/Polynomial_kernel and Page 352 of the Introduction to Statistical Learning in R.
1. Is there a relationship between the values of d and r in polynomial kernel, and the number of output dimensions? 2. At 3:27 why is the 3rd term ignored, is this part of the kernel trick? Are the 3rd terms always the same no matter what d or r is used? 3. It seems that the dot product exists only because d=2 which after expansion allows the expression to be expressed as a dot product, if d=3 then we cannot express as a dot product of 2 terms anymore? 4. Does this whole video apply to other kernels too?
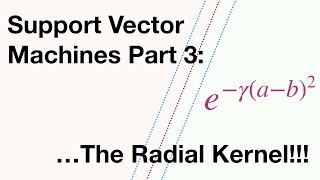
1) d ends up being the number of dimensions. 2) Regardless of the values for 'a' and 'b', the last dimension will always have the exact same value, 1/2. Thus, it will not help us establish how 'a' and 'b' are related. 3) If d=3, then we get a^3b^3 + 3a^2b^2 + 3ab + 1 = the following dot product (a^3 + sqrt(3)2^ + sqrt(3)a + 1) dot (a^3 + sqrt(3)2^ + sqrt(3)a + 1) 4) This video provides the background for understanding how the RBF kernel works. For details on that, see: th-cam.com/video/Qc5IyLW_hns/w-d-xo.html
@@statquest Thanks a lot now i get the idea of how you can for 3), always use square roots to split up the constants, then put a and b into the 2 terms of the dot product. Also, for 1) I see the number of terms of (x+y)^n is n+1, but we always throw the last term since it's a constant that square roots to equal constants for both points, so end up having n dimensions. How did people invent these kernels? Did the kernel trick come later as a hack to overcome computation constraints, or it came first before a whole class of kernels was discovered possible? Also, why is there an obsession with learning straight lines through the data (no matter raw/dimension raised), has this got to do with limitations of the optimization method (I think you mentioned in other comments it uses gradient descent). Because i'm thinking if it could generate non straight lines, then maybe there's no need to raise to higher dimensions?
@@Han-ve8uh I don't know how people came up with the kernel trick. However, straight lines are usually much easier to optimize than curved ones. However, neural networks, which I describe here, fit curved lines to data: th-cam.com/video/CqOfi41LfDw/w-d-xo.html
Amazing explanation:) We find the High Dimensional Relationship between 2 points to be 16002.25. Practically what do we do with this value.? How do we find the Support Vector Classifier with this value.?
At 6:33 you mention that we need to determine the value of both r and d through cross validation. If we have one dimensional data then shouldn't be d = 2 only?
I think you got too attached to the example. Imagine the same example but with the two colors all mixed up. Then I think that d = 2 would not be enough to split things up!
Great explanation 👍 Thanks a ton Josh!!. But, a bit confused here on how to calculate appropriate 'r' coefficient for the eqn.I understand that 'd' value is calculated using Cross Validation
'r' is also determined by cross validation, but I am under the impression that it doesn't have as much impact as 'd'. It basically scales things by a constant, rather than adding extra dimensions.
@@thememace it doesn't get completely ignored. When r=1/2, the math works out such that the x-axis doesn't get scaled at all. But when r=1, the x-axis gets scaled by sqrt(2). Even though the third element of the vectors combined by dot product is a constant (and thus ignored), the choice of r still affects how the dot product evaluates because of how it changes the first element of each vector.
The high dimensional relationship you calculated at the end is a number which tells what exactly? How does it help to pseudo transform into higher dimensions?
Are you familiar with Gradient Descent? th-cam.com/video/sDv4f4s2SB8/w-d-xo.html SVMs use a different algorithm, but the idea is similar, and you can think of the numbers, like 16002.25 as values that the algorithm is trying to optimize.
since the kernel requires to calculate the dot product for each couple of points, suppose we have 10 points when we do it just for each point with respect to the others and itself we should obtain 10 different dot products for each single point. Which one of those 10 dot products become the new "y" dimension of the point?
None of them end up being the new "y" dimension. The kernel trick works without having to make that transformation. We use the transformation to give an intuition of how the process works, but the kernel trick itself bypasses the transformation. This is the "kernel trick", and I mention it in the first video in the series on SVMs: th-cam.com/video/efR1C6CvhmE/w-d-xo.html
@@statquest yes i misunderstood before, now i got it: when we plug the values into the polynomial expression is equivalent to calculate the dot product in higher dimensions. And since the SVM only depends on those dot products among point we have just "improved" the classification mimicking the dot product in higher dimensions as musch as infinite like with RBF. Still thank you for all your efforts and your gentle replies to our questions. Regards.
quick question : why it is useful to calculate the relationships between every two point regardless in any dimensions , how it can be useful for calculating the decision boundary ?
SVM's are optimized using an iterative algorithm that is similar to Gradient Descent, and the relationship values are essentially the "loss" values and help move the SVC to the correct spot.
Visually thinking about the last set of data: if you can draw a line to separate the data if you square each observation to the y-axis, then you can draw a line independently of the scale/ratio of the x-axis. Then I see is that the only thing that it is adding "solving/math value" is increasing the order of the xi-axis to fit a hyperplane (d value). What r contributes to arrive to a better solution?
Dear Sir, Kernels are basically used for finding the relationship between two points using the formulae. How do we further find the Support vector classifier?
I am still not clear what happened after finding a relationship in higher dimension like in the video what happened after finding 16002.25 ?? Can you please add a short video over the same if possible.
When we calculate relationships between 2 data points, do we calculate relationships between all the points w.r.t all the other points? Ex: if we have 4 data points (1,2,3,4) do we calculate relationship between (1,2) and (3,4) OR do we calculate relationship between (1,2),(1,3),(1,4),(2,3)...etc
@@statquest Thank you. I should have mentioned that I have small data set and I take all datapoints as training set and do 10 fold cross validation. I am concerned about having ovefitting.
Amazing video as always. The only thing I don't understand is that when you were talking about how the kernel function calculates the "relationships" between the observations in higher dimension without doing transformation. What exactly do you mean by relationships? In the one-dimensional case, the relationship is simply the distance between points, but in the high-dimensional cases, it was the dot product (instead of Euclidean distances), why is that?
@5:09, u said that we need to calculate dot product between each pair of point. How do we use this dot product further? could u please clear to me, u r the only person on whole internet who can clear this. :D
We use it as input to an iterative optimization algorithm similar to gradient descent. For details on gradient descent, see: th-cam.com/video/sDv4f4s2SB8/w-d-xo.html
It's used as a measure of the relationship between two points. Once we calculate the relationships between all of the points, they are used in a method similar to Gradient Descent to find the optimal classifier.
The algorithm that finds the optimal Support Vector Classifier uses that number. The algorithm is iterative, like Gradient Descent. So, maybe think of that value as sort of like part of the derivative that we need to find a step size.
Hi Josh, I couldn't get how 16002.25 will help us in drawing the Support Vector Classifier, In comments below you mentioned: "In some sense the "relationships" are similar to transforming the data to the higher dimension and calculating the distances between data points." even this above explanation did not help, if 16002.25 is one of the 2-dimensional relationships that we need to solve for the support vector classifier, what is the other one? how do we get the classifier?
Are you familiar with Gradient Descent? th-cam.com/video/sDv4f4s2SB8/w-d-xo.html SVMs use a different algorithm, but the idea is similar, and you can think of the numbers, like 16002.25 as values that the algorithm is trying to optimize.
You mentioned "We need all pairs relationship in high dimensional space to find the Support Vector Classifier". But how? For example, we have 10 data points in 1-dimensional space (i.e. 10 scalars), each of them is either Red or Green. Suppose we use Polynomial Kernel with d=2. So we would end up with 10C2 pairs relationship. From these 10C2 numbers, how can we define the Support Vector Classifier?
Explaining exactly how the kernel trick works and is optimized would take a whole own its own. This video was just intended to help understand what the polynomial kernel does.
@@khanhtruong3254 Cool. The process for converting the dot products into an optimal classifier is iterative an not a lot different from Gradient Descent, but it's different enough that I'd have to go into all kinds of details.
Hi Josh, the explanation is amazing. I had a question- you said that the equation (a*b + r) ^d is used for finding the relationship between two points, how is this found relationship used for getting where the Support Vector Classifier?
Unfortunately the details of how it is used would require a whole video and I can't cram it into a comment. However, making the video is on the to-do list.
Josh, this is a great video. One question on the Polynormal Kernal derivation. So the original problem was to find a classification point to find drug usage limits that cures or doesnt cure the disease. When we increased the value of 2, you mentioned it introduced a second dimension. I understood, how squaring the value helped to find a better Marginal classifier line, but ideally there is no meaning to the y axis here right, because the case still remains the same. We are just finding if the drug usage had a positive or negative impact. we could still use the y axis to determine its efficity, but if we increase the value to 3, what would Z axis represent here. Sorry if the question was confusing
The new dimensions don't mean anything at all - they are just extra dimensions that allow us to curve and bend the data so that we can separate it. The more dimensions, the more we can curve and bend the data.
Hi StatQuest. you said the 'a' and 'b' are two different observations is this means that the k(a, b) depends on the number of classes. For example, if I have 4 classes does it means k(a, b, c, d)?
I'm not sure how this works with more than 2 classes. Usually when there are more than 2 classes, people create one classifier per class and do 1 vs all other classification. So each classifier is still only separating 2 classes.
respected josh sir, thank you for such amazing explanation..sir please help me i have a doubt. will we take the dot products for every pair of points like first red point with all the green points and then so on or we will take first red point with first green point and so on..
After getting the value of r and d by cross validation we get the value of 16002.25. But how to use this value to determine the high dimensional relationship?? This video was really helpful to understand the topic despite of me being from a different background. Thanks.
The actual method for finding the classifier would require a whole video on it's own. It's like gradient descent, but with a few important differences.
Hello sir, In the above example It was clear that new transformed axes were a,a^2 but It wasnt clear the mechanism how classifier draws line. Do we get the equation of that classification line from kernel function,dot product or something related?
The output of the kernel function (the dot-products) is fed into an iterative algorithm (similar to gradient descent) to find the optimal support vector classifier.
I don't understand why we need to calculate the dot products at all. I have a basic idea that the loss function for svm includes calculation of dot products between the observations but I don't understand the intuition behind it. i.e. what actually dot products (similarities) between observations do in finding the hyperplane that classifies the observations. And also they say we have to minimize |w| to get the optimal hyperplane but what is the geometrical intuition behind minimizing the |w|
Hi, Thanks a lot for your content. It is very easy to understand and I appreciate your way of explaining things. I had one doubt. Can you please explain how does Cross-validation help to determine the optimal degree of the polynomial kernel used in SVM's?
Hi Josh,Thanks for the video. You are helping me a lot. I have just one question. What do you mean by "high dimensional relationship"? Because It can be achieved by any 2 numbers that has multiplication result of 126 which is Infinite.Its just a dot product of two 3 dimensional data.Cross Validation uses misclassification rate to select best r and d as far as i know. Do CV use these numbers on any calculation?
Cross Validation does not use these high-dimensional relationships. Instead, the algorithm that finds optimal fits, given constraints (like the number of misclassifications you will allow) uses them. Although the dot product seems like it would be too simple to use, it has a geometric interpretation related to how close the points are to each other. For more details, check out the Wikipedia article: en.wikipedia.org/wiki/Dot_product
Hey, great video, thanks! What happens after the transformation though? I mean, how does the final result. i.e. a scalar corresponding to relationship between each observation, help in identifying an optimally classifying hyperplane?
The value is used in a way similar to how loss values are used in Gradient Descent. There is an iterative algorithm that uses the values to optimize the fit.
Those are user defined parameters, which is why I also illustrate the effects of choosing alternative values at 3:41. Typically you use cross validation to find the best values to use.
So what do we do after we have the value for every green and red dot? Draw the hyperplane between the pair which had the maximum value (doesn't make a lot of sense though)?
@@statquest No, suppose we have 16002.25 after applying kernel for a=9 and b=14. Then what? How is the SVC made with a value of 16,000 for values of 9 and 14...for this current case (I understand that a lot of SVC will be made and checked before deciding upon the final SVC)
@@yashmishra12 Unfortunately, the answer to your question is way out of the scope of the space provided for comments. However, for more information that have all of the details, check out: www.cs.cmu.edu/~epxing/Class/10701-08s/recitation/svm.pdf
One suggestion: if at the beginning, if the all the topics are listed in a logical way, it would even better. Big thanks for the videos, really appreciate it 🙏
I believe you just create one SVM per classification, and each SVM compares one classification to all the others (i.e. a sample either has that classification or not).
What I understood the function of kernel is to transform the data into high dimension so that there exists a classifier in that dimension which seperates those points. Right? If yes than why not just square each value instead of getting each pair to kernel function?
The kernel provides us with the high-dimensional relationships between points without actually doing the transformation. This is the "kernel trick" and it saves time and makes it possible to determine the relationships between points in infinite-dimensions (which is what the radial kernel does).
I didn't actually get where are these used, like I've read abt stuff you explained in the first video regarding SVM's. Any supporting text you recommend that I should read to grasp this better... Like I understood the formula, what is it for, what are the terms abrd and all that, but I feel something is missing
The idea of SVMs is to move the data into a higher dimension so that we can separate it with a support vector classifier. The Polynomial Kernel is one way to move the data into a higher dimension. For more details, see: th-cam.com/video/efR1C6CvhmE/w-d-xo.html Specifically - keep watching until the end because we'll touch on how the polynomial kernel works in that setting.
@@statquest Ooooo, so this (using the polynomial kernel) is a technique for finding out what dimension (parameter) is the best for which we can draw a hyperplane to separate different classes ? Thanks for replying sir :)
Great video thank you. But I don't understand why the kernel with dot product is more computationally efficient than transform the data in 2 dimension, because in any case we have to raise a and b, the observations (the data so), to the square, and that is transform the data in 2 dimensions no ? and then we do the dot product... So I'm missing sthg here but I can't see what. thank you very much !
@@statquest sorry my question was not really clear. What is data transformation exactly ? It s raising data/feature to the square ? If this is the case, why svm is more efficient whereas we still need to compute observarions/data to the square i.e a² and b² ? Again sorry if there is misunderstanding from myself i m new to maths and ML
@@geogeo14000 It's not that the transformation itself is inefficient, it's finding the optimal Support Vector Classifier. This is done using an iterative procedure that operates on just the dot products, rather than the distances in higher dimensions.
When you say relationships between observations, what exactly do you mean? You didn't really go over how such relationships allow you to find an SVC in the higher dimension?
If you remember how we moved from 1-D to 2-D (at 2:54)...then if you start with 2-D data then 'a' and 'b' are 2-D vectors. Now set r=1/2 and d=2 and you will get the original 2-D vectors, plus the values in the 2-D vectors, squared. So this will move you from 2-D to 4-D. So I'm not sure you can go from 2-D to 3-D directly.
Yes, and that is what is done in the video. We use the original a and b values to calculate the y-axis coordinates. However, the x-axis values are still the sqrt(2)*a and sqrt(2)*b, so the values have coordinates (sqrt(2)*a) , a^2)
First, think of a dot product as a type of measure of similarity (the larger the absolute value, the more similar) and that similarity can be a proxy for closeness. Then those measures are plugged into an iterative algorithm, somewhat like gradient descent (see: th-cam.com/video/sDv4f4s2SB8/w-d-xo.html ), to find the optimal classifier.
I didn't get how the kernel relationship value is used to transform the data. In the theory, the kernel relationship is a square matrix, containing kernel values for all samples 2 by 2. You calculated one of these at the end, but how to use them to transfer the initial data? what is the function or algorithm?
Explaining how the kernel values are used would require a bunch more videos. However, the quick and easy version is that it uses an iterative algorithm that is similar (but not the same) as gradient descent to find the optimal classifier.
@@statquest Thanks a lot. You have shown a manual transformation in 3:30. My question is what are 'a' and 'b'? any pair of samples regardless of their labels? if so, how it works when a=x1 is used in different dot products (first with b=x2 and then with b=x4)? I hope I could clarify my point
Hello at 6.04 you said why is it a dot product is beyond the scope of this video.. can you help me materials which can help me go through it to find out why it's a dot product and not a cross product? maybe a book will do. Thanks
Thanks for the amazing video. Please, if I have 100 samples for training and each with 5 features and try to apply 2D polynomial. So how my data is converted to a higher dimension? in other words what do we mean by the two input vectors in the polynomial equation?
In this case, the vectors for each point, a and b, contain values for all 5 features and the arithmetic shown in the video is applied to the values for all 5 features.
@@statquest Thanks Dr Josh. Actually, my question is about how to choose the vectors themselves? As I understand from your video, I guessed that the relationship is taken of each point with all others, so the the resulted points are higher in number than the previous! And the features dimensions are already enlarged! Am I right?
@@vianadnanferman9752 Forgive me if I'm just repeating what you wrote, but we calculate all of the different relationships between all of the points. The process of calculating the relationships gives us the features in the higher dimensional space.


Support StatQuest by buying my book The StatQuest Illustrated Guide to Machine Learning or a Study Guide or Merch!!! statquest.org/statquest-store/
How do I get it from Nigeria.
I'd love to.
@@davidonwuteaka2642 Unfortunately I don't have distribution of physical (printed) copies in Nigeria, but you can get the PDF.
Yes, I have been trying to but the site kept rejecting my card.
Thanks for your reply.
@@davidonwuteaka2642 Bummer! I'm sorry to hear that.
Your videos should be mandatory tutorial for Data Science/ ML courses in all the Universities. Students throughout the world would get benefited after watching the best ML video.Hats off to you great Josh Starmer..............
Wow, thanks!
Not mandatory, but my prof recommends this channel after every slide/lecture.
@@rameshmitawa2246 That's awesome!
I believe because most instructors don't teach it. They simply give information ....Josh actually explains difficult concepts in a simple way.
I will make it easy for you guys:
3:38 - BAM
4:49 - DOUBLE BAM
5:54 - TRIPLE BAM
Just the hits! BAM! :)
Thanks I know statistics now
Dude, You are amazing. The best tutorial on SVM. I have searched the entire Internet to understand but couldn't. Please continue to make videos.
Thanks, will do!
Best machine learning playlist I have encountered on the TH-cam .
The animations and your funny way of teaching makes it easy to understand concepts.
The amount of work you put to create these videos deserves great appreciation.
I would definitely recommend to go through the videos for anyone who is reading this comment.
Glad you like them!
Bro you're just a blessing. Never stop with the dry humor. Lot's of love for you!
Thank you! Will do!
I have read and looked at most recommended books and videos on kernels and whilst somewhat familiar with the math, never truly understood the principles.
Statquest actually makes complex topics simple, arguably one of the best if not the best teacher on youtube and definitely the best stat explanations.
Thanks Josh much appreciated 👍
Thank you very much! :)
I want to thank you so much for all your videos. I was lost in a forest of vectors matrices and greek letters when I heard about these topics in lecture and I did not understand a thing. As I was practising for the exam, I discovered your videos and now I do actually understand what is happening. Really love the practical, example driven approach!
Awesome!!!! Good luck with your exam and let me know how it goes. :)
This is one of the best explanation for support vector machines... If anyone is interested in why dot products are integral to the idea of SVM, please refer to Professor Wilson's MIT lecture on SVM... It is another great explanation for SVM...
Thanks! :)
My man. I'm so happy I have my presentation about SVM's after your uploads... Keep up the great work!
Awesome! :)
You are videos are simply amazing! And the level of abstraction is right at the sweet spot! Thank you for the extremely thoughtful and precise illustrations!
Thank you very much! :)
First of all, thanks for your explanation, after plugging two data points into polynomial kernel function a and b then get the value 16,002.25, then you said we get higher dimensional relationship. Could you elaborate further what "relationship" did you refer to based on the value 16,002.25? Sorry I was not quite sure about that
In some sense the "relationships" are similar to transforming the data to the higher dimension and calculating the distances between data points.
@@statquest But the value 16002.25 alone is a 1-D data point. How do you suppose that helps us classify? Am I missing something?
@@vedgupta1686 Think of that number is a loss value that is used as input for an iterative optimization algorithm like gradient descent.
I thought the whole point of using the kernel trick was to save on the computation cost. If we are using an iterative algorithm anyway, how is that better than transforming the data?
@@HeduAI Either way you would still have to use an iterative procedure. So that computation is fixed.
I really appreciate how the way it is explained. Please keep on the good job!
Thank you!
What do you mean by high dimension relationship??
like the distance but in higher dimensions
a synonym for 'high dimension' is many features or variables. Relationship think connection(s). So if we have a high D. relationship, we have a set of many variables that are connected by some idea or mathematical formula. Does that help?
watch first video (Part I)
@@Actanonverba01 that's what I thought but that is irrelevant here because we only have obe variable with two possible categories of values. But of course we can add more connecfions and variables which I think is what you are alluding to
@@leif1075 It's not actually what he means and it's not irrelevant. High dimensional space means we take our original input feature space (in this case just X1) and transform it into higher dimensional space by "making up" new dimensions that are functions of our original dimensions (X1) so that the data is linearly separable in that new space. The pair wise relationships (aka similarity) are the dustances between the observations projected into that higher dimensional space (usually referred to as latent space). So it doesn't matter how many features you have in your original dataset nor how many outcome classes you have - those are irrelevant to the SVM algorithm mechanics, they only change the scale.
thank you a lot you are such a big help in this harsh student world god bless you .
I'm glad you like my videos! :)
@@statquest we just don't only like them we love your videos XOXO
@@statquest this doesnt show where on esrth you dsrive that formula from..WHY do you multiply a times b and then add r
.why not multiply all three or add all three..see what I mean? I don't see how anyone could figure itnout..not enough info here to derive it
Sir, this is the best video for explaining the Kernel!
Glad you think so!
I have grown to love your little songs. They sound like Pheobe's songs!!! I have a little question , what do you use for visualization?
Thanks! I draw all the pictures in Keynote.
That's exactly what I and my sister agreed just before we saw your comment! haha.
@Leila Mohammadzadeh Google "svm lagrange dual" and you will see how SVM uses the dot products to find the classifier.
This is how concepts should be introduced to students.. makes so much more sense
Thank you! :)
After a lonnnnggg waitttt..... MEGAA MEGAAA MEGAAAA BAMMM is back
Ha! Thank you! :)
Earlier i had an intuition of all Algos which was incomplete and which could not be explained to others, Concepts are getting cleared now. Thanks STATQUEST Team, Josh Starmer, will contribute ASA i get a job in DS field.
bam! :)
It is awesome and satisfing to be able to learn an intuition with these videos and reading a textbook understanding everything. THANKS
Awesome! I'm glad the videos are helpful! :)
@@statquest BAM!!!
Would love to see more math after seeing the big picture behind these algorithms 😄
Thank you for this video! It was very helpful in terms of understanding the details of how the kernel function leads to certain equations that need to be solved to obtain the relevant Support Vector Classifier!
Bam! :)
You literally saved my homework with your videos
Bam!
Thank you very much, the explanation is easier to understand compare to my class!
Glad it helped!
Thanksss Josh Starmer.I am facinated because of your videos.
Please make a video about how 16002.25 is used bam?.
Moreover I think that you can make video playlist about how machine learning algorithms has coded double bamm .
Keep going man, we love you triple bamm!!!
Great suggestions!
@@statquest How is the relationship of 16.002,25 to be interpreted?
I understood that if we transfer everything to the higher dimension we can solve it, but I did not understand the part about relationships between the points and how they help.
@@kevinarmbruster2724 We plug the relationships into an algorithm that is similar to gradient descent and it can use them to find the optimal classifier. However, the details are pretty complex and would require another video.
Mr. Starmer almost unconsciously changing machine Learning's future 😀
:)
First of all thankyou so much for explaining with such amazing illustrations. One doubt, how can we actually use relationship between points to find the support vector classifier?
Unfortunately that's a difficult question to answer and I'd have to dedicate a whole video to it. However, the simple answer is that it uses a method like Gradient Descent to find the optimal values.
@@statquest Thanks for the response! Hopefully later you'd dedicate a whole video to it :)
I've understood more than I ever expected to understand in this topic all thanks to your videos.
But now I've stumbled a bit: How do you solve a constant like the one in 5:50? Or what does solving mean in that context now that it isn't a formula? Could you please expand on that?
Think of it as a loss value, and it is something we try to optimize with an iterative algorithm that is similar to Gradient Descent: th-cam.com/video/sDv4f4s2SB8/w-d-xo.html
God bless you Josh STARmer
Thank you very much! :)
You my friend are a champion. Yes.
Thank you! :)
I could be wrong, but I think there is a slight mistake in this video. The kernel function should be of the form (ab-1/2)^2. This is because the support vector classifier is essentially thresholding based on whether x>y or not. Let me know please if I am wrong. And, thanks for your cool videos.
Most people define it the way I defined it in the video, (ab + r)^d. For more details, see: en.wikipedia.org/wiki/Polynomial_kernel and Page 352 of the Introduction to Statistical Learning in R.
Awesome! Josh is back.
:)
1. Is there a relationship between the values of d and r in polynomial kernel, and the number of output dimensions?
2. At 3:27 why is the 3rd term ignored, is this part of the kernel trick? Are the 3rd terms always the same no matter what d or r is used?
3. It seems that the dot product exists only because d=2 which after expansion allows the expression to be expressed as a dot product, if d=3 then we cannot express as a dot product of 2 terms anymore?
4. Does this whole video apply to other kernels too?
1) d ends up being the number of dimensions.
2) Regardless of the values for 'a' and 'b', the last dimension will always have the exact same value, 1/2. Thus, it will not help us establish how 'a' and 'b' are related.
3) If d=3, then we get a^3b^3 + 3a^2b^2 + 3ab + 1 = the following dot product (a^3 + sqrt(3)2^ + sqrt(3)a + 1) dot (a^3 + sqrt(3)2^ + sqrt(3)a + 1)
4) This video provides the background for understanding how the RBF kernel works. For details on that, see: th-cam.com/video/Qc5IyLW_hns/w-d-xo.html
@@statquest Thanks a lot now i get the idea of how you can for 3), always use square roots to split up the constants, then put a and b into the 2 terms of the dot product. Also, for 1) I see the number of terms of (x+y)^n is n+1, but we always throw the last term since it's a constant that square roots to equal constants for both points, so end up having n dimensions.
How did people invent these kernels? Did the kernel trick come later as a hack to overcome computation constraints, or it came first before a whole class of kernels was discovered possible?
Also, why is there an obsession with learning straight lines through the data (no matter raw/dimension raised), has this got to do with limitations of the optimization method (I think you mentioned in other comments it uses gradient descent). Because i'm thinking if it could generate non straight lines, then maybe there's no need to raise to higher dimensions?
@@Han-ve8uh I don't know how people came up with the kernel trick. However, straight lines are usually much easier to optimize than curved ones. However, neural networks, which I describe here, fit curved lines to data: th-cam.com/video/CqOfi41LfDw/w-d-xo.html
Amazing explanation:) We find the High Dimensional Relationship between 2 points to be 16002.25.
Practically what do we do with this value.? How do we find the Support Vector Classifier with this value.?
It's quite complicated - way too complicated to be described in a comment.
StatQuest with Josh Starmer
Okay. I love all you videos, especially your intro songs! Great work keep it going Josh :)
I want this answer too!
@@statquest I want answers for the question. It'll be helpful if you could share links to resources on this
@@balasubramanian5232 Google "svm lagrange dual" and you will have lots and lots of resources.
At 6:33 you mention that we need to determine the value of both r and d through cross validation. If we have one dimensional data then shouldn't be d = 2 only?
Why do you say that?
I think you got too attached to the example. Imagine the same example but with the two colors all mixed up. Then I think that d = 2 would not be enough to split things up!
@@hemersontacon3168 That's an insightful comment that actually opened my eyes. Thank you.
@@ccuny1 Glad to know and glad to help ^^
First comment! I have turned on notification for your videos. I love all of your videos!
Awesome! Thank you! :)
Great explanation 👍 Thanks a ton Josh!!. But, a bit confused here on how to calculate appropriate 'r' coefficient for the eqn.I understand that 'd' value is calculated using Cross Validation
'r' is also determined by cross validation, but I am under the impression that it doesn't have as much impact as 'd'. It basically scales things by a constant, rather than adding extra dimensions.
@@statquest What's the point of setting r anyway since it later gets completely ignored?🤔
@@thememace I'm not sure
@@thememace it doesn't get completely ignored. When r=1/2, the math works out such that the x-axis doesn't get scaled at all. But when r=1, the x-axis gets scaled by sqrt(2). Even though the third element of the vectors combined by dot product is a constant (and thus ignored), the choice of r still affects how the dot product evaluates because of how it changes the first element of each vector.
super clear tut. Thank you very much! But as a non-English native speaker, I am a little confused, what is BAM trying to express?
th-cam.com/video/i4iUvjsGCMc/w-d-xo.html
@@statquest
A tut for BAM! cool lol
After we find the dot product, with that value how we decide whether the new sample belongs to positive class or negative class?
Please clarify Josh.
It's a little too much to put into a comment. The purpose of the video was only to give insight into how the kernel works, not derive the math.
machine learning algorithimss!!! is it just me or other who has to learn these again n again to fill the gap in knowledge
bam!
The high dimensional relationship you calculated at the end is a number which tells what exactly? How does it help to pseudo transform into higher dimensions?
Are you familiar with Gradient Descent? th-cam.com/video/sDv4f4s2SB8/w-d-xo.html SVMs use a different algorithm, but the idea is similar, and you can think of the numbers, like 16002.25 as values that the algorithm is trying to optimize.
since the kernel requires to calculate the dot product for each couple of points, suppose we have 10 points when we do it just for each point with respect to the others and itself we should obtain 10 different dot products for each single point. Which one of those 10 dot products become the new "y" dimension of the point?
None of them end up being the new "y" dimension. The kernel trick works without having to make that transformation. We use the transformation to give an intuition of how the process works, but the kernel trick itself bypasses the transformation. This is the "kernel trick", and I mention it in the first video in the series on SVMs: th-cam.com/video/efR1C6CvhmE/w-d-xo.html
@@statquest yes i misunderstood before, now i got it: when we plug the values into the polynomial expression is equivalent to calculate the dot product in higher dimensions. And since the SVM only depends on those dot products among point we have just "improved" the classification mimicking the dot product in higher dimensions as musch as infinite like with RBF.
Still thank you for all your efforts and your gentle replies to our questions. Regards.
quick question : why it is useful to calculate the relationships between every two point regardless in any dimensions , how it can be useful for calculating the decision boundary ?
SVM's are optimized using an iterative algorithm that is similar to Gradient Descent, and the relationship values are essentially the "loss" values and help move the SVC to the correct spot.
@@statquest
So how to know That Is the best dimension i'm looking for according the relationship between every two points?
@@beshosamir8978 www.cs.cmu.edu/~epxing/Class/10701-08s/recitation/svm.pdf
Visually thinking about the last set of data: if you can draw a line to separate the data if you square each observation to the y-axis, then you can draw a line independently of the scale/ratio of the x-axis. Then I see is that the only thing that it is adding "solving/math value" is increasing the order of the xi-axis to fit a hyperplane (d value). What r contributes to arrive to a better solution?
I don't think it adds much.
best tutorial for SVM , YOU DID IT THANKS
Thank you! :)
Thank you Josh. Just..thank you
:)
Amazing vid! Thanks helping me prepare for my Machine Learning exam 😁
Good luck and let me know how it goes. :)
@@statquest It went well for a difficult exam. BUT I had a lot to write about thanks to this channel. Appreciate it ❤️
@@NathanPhippsONeill Hooray!!! That's awesome and congratulations. :)
Dear Sir,
Kernels are basically used for finding the relationship between two points using the formulae. How do we further find the Support vector classifier?
The SVC is found using an iterative process that is a lot like Gradient Descent, and the output from the kernels is like the "loss" values.
Does anyone laugh at how silly yet genius Josh is? Loved the robot.. I rewinded to do the robot.
You are my favorite! Thank you so much! I'm glad you enjoy the silly sounds.
I am still not clear what happened after finding a relationship in higher dimension like in the video what happened after finding 16002.25 ?? Can you please add a short video over the same if possible.
It would be a long video, but it's on the to-do list.
Thank you for the video! And now, what does this number 16002.25 tell us? :D How will we know what the right dosage?
That's just an example of the kind of values that are used by the kernel trick to determine the optimal placement of the support vector classifier.
When we calculate relationships between 2 data points, do we calculate relationships between all the points w.r.t all the other points? Ex: if we have 4 data points (1,2,3,4) do we calculate relationship between (1,2) and (3,4) OR do we calculate relationship between (1,2),(1,3),(1,4),(2,3)...etc
We calculate all of the relationships.
How overfitting is evaluated in SVM? How do you check whether the output of SVM is generalizable or not?
You compare the classifications made with the training dataset to classifications made with the testing dataset.
@@statquest Thank you. I should have mentioned that I have small data set and I take all datapoints as training set and do 10 fold cross validation. I am concerned about having ovefitting.
Amazing video as always. The only thing I don't understand is that when you were talking about how the kernel function calculates the "relationships" between the observations in higher dimension without doing transformation. What exactly do you mean by relationships? In the one-dimensional case, the relationship is simply the distance between points, but in the high-dimensional cases, it was the dot product (instead of Euclidean distances), why is that?
Oh, just realized you mentioned that it was outside the scope of this video, my bad 😂
Yeah, one day I hope to do a whole video on how this works.
@5:09, u said that we need to calculate dot product between each pair of point. How do we use this dot product further? could u please clear to me, u r the only person on whole internet who can clear this. :D
We use it as input to an iterative optimization algorithm similar to gradient descent. For details on gradient descent, see: th-cam.com/video/sDv4f4s2SB8/w-d-xo.html
@@statquest thank u so much ☺️
bam. love it homie. keep it up
Thank you!
I did not understand what that 16000 value means or how it helps us. Could you please clarify? Everything else was crystal clear :)
It's used as a measure of the relationship between two points. Once we calculate the relationships between all of the points, they are used in a method similar to Gradient Descent to find the optimal classifier.
Guys at 06:45 what do I do with the value of 16,002.25??Also what does a relationship mean between two points?
The algorithm that finds the optimal Support Vector Classifier uses that number. The algorithm is iterative, like Gradient Descent. So, maybe think of that value as sort of like part of the derivative that we need to find a step size.
Thank you for the reply Josh, that cleared some doubts for me
Hi Josh,
I couldn't get how 16002.25 will help us in drawing the Support Vector Classifier,
In comments below you mentioned: "In some sense the "relationships" are similar to transforming the data to the higher dimension and calculating the distances between data points."
even this above explanation did not help, if 16002.25 is one of the 2-dimensional relationships that we need to solve for the support vector classifier, what is the other one? how do we get the classifier?
Are you familiar with Gradient Descent? th-cam.com/video/sDv4f4s2SB8/w-d-xo.html SVMs use a different algorithm, but the idea is similar, and you can think of the numbers, like 16002.25 as values that the algorithm is trying to optimize.
To find the value of r and d, can we use GridSearhCV as well?
Yes. GridSearchCV is just a way to do CV.
You mentioned "We need all pairs relationship in high dimensional space to find the Support Vector Classifier". But how? For example, we have 10 data points in 1-dimensional space (i.e. 10 scalars), each of them is either Red or Green. Suppose we use Polynomial Kernel with d=2. So we would end up with 10C2 pairs relationship. From these 10C2 numbers, how can we define the Support Vector Classifier?
Explaining exactly how the kernel trick works and is optimized would take a whole own its own. This video was just intended to help understand what the polynomial kernel does.
@@statquest Thank you very much. I was afraid that point was too obvious to explain. Your confirmation gives me back confidence :D. Big fan of ya.
@@khanhtruong3254 Cool. The process for converting the dot products into an optimal classifier is iterative an not a lot different from Gradient Descent, but it's different enough that I'd have to go into all kinds of details.
John Starmer, you are a genius sir!!
Thank you! :)
First of all congratulations! your videos are super explanatory! One question: The equation of the polynomial kernel has always the same form?
As far as I know. However, the variables might have different names.
Hi Josh, the explanation is amazing. I had a question- you said that the equation (a*b + r) ^d is used for finding the relationship between two points, how is this found relationship used for getting where the Support Vector Classifier?
Unfortunately the details of how it is used would require a whole video and I can't cram it into a comment. However, making the video is on the to-do list.
i love u my man you really are a life saver. Just because of that i am gonna buy a tshirt
BAM! Thank you very much! :)
Josh, this is a great video. One question on the Polynormal Kernal derivation. So the original problem was to find a classification point to find drug usage limits that cures or doesnt cure the disease. When we increased the value of 2, you mentioned it introduced a second dimension. I understood, how squaring the value helped to find a better Marginal classifier line, but ideally there is no meaning to the y axis here right, because the case still remains the same. We are just finding if the drug usage had a positive or negative impact. we could still use the y axis to determine its efficity, but if we increase the value to 3, what would Z axis represent here. Sorry if the question was confusing
The new dimensions don't mean anything at all - they are just extra dimensions that allow us to curve and bend the data so that we can separate it. The more dimensions, the more we can curve and bend the data.
Hi StatQuest. you said the 'a' and 'b' are two different observations is this means that the k(a, b) depends on the number of classes. For example, if I have 4 classes does it means k(a, b, c, d)?
I'm not sure how this works with more than 2 classes. Usually when there are more than 2 classes, people create one classifier per class and do 1 vs all other classification. So each classifier is still only separating 2 classes.
respected josh sir, thank you for such amazing explanation..sir please help me i have a doubt. will we take the dot products for every pair of points like first red point with all the green points and then so on or we will take first red point with first green point and so on..
All pairs
Thank you sir
Good job Josh
:)
waited too long... Thanks a ton
After getting the value of r and d by cross validation we get the value of 16002.25. But how to use this value to determine the high dimensional relationship??
This video was really helpful to understand the topic despite of me being from a different background. Thanks.
The actual method for finding the classifier would require a whole video on it's own. It's like gradient descent, but with a few important differences.
@@statquest Please make a video on that ,it will be very helpful for us.
Hello sir,
In the above example It was clear that new transformed axes were a,a^2 but It wasnt clear the mechanism how classifier draws line.
Do we get the equation of that classification line from kernel function,dot product or something related?
The output of the kernel function (the dot-products) is fed into an iterative algorithm (similar to gradient descent) to find the optimal support vector classifier.
I don't understand why we need to calculate the dot products at all.
I have a basic idea that the loss function for svm includes calculation of dot products between the observations but I don't understand the intuition behind it.
i.e. what actually dot products (similarities) between observations do in finding the hyperplane that classifies the observations.
And also they say we have to minimize |w| to get the optimal hyperplane but what is the geometrical intuition behind minimizing the |w|
Question: The video ends as getting the relationship. I wonder what does it mean and how can we get the optimal hyperplane from here? thanks!
It's an iterative method that is like gradient descent.
Hi,
Thanks a lot for your content. It is very easy to understand and I appreciate your way of explaining things. I had one doubt. Can you please explain how does Cross-validation help to determine the optimal degree of the polynomial kernel used in SVM's?
I do that in this video: th-cam.com/video/8A7L0GsBiLQ/w-d-xo.html
Hi Josh,Thanks for the video. You are helping me a lot. I have just one question. What do you mean by "high dimensional relationship"? Because It can be achieved by any 2 numbers that has multiplication result of 126 which is Infinite.Its just a dot product of two 3 dimensional data.Cross Validation uses misclassification rate to select best r and d as far as i know. Do CV use these numbers on any calculation?
Cross Validation does not use these high-dimensional relationships. Instead, the algorithm that finds optimal fits, given constraints (like the number of misclassifications you will allow) uses them. Although the dot product seems like it would be too simple to use, it has a geometric interpretation related to how close the points are to each other. For more details, check out the Wikipedia article: en.wikipedia.org/wiki/Dot_product
5:27 But what happens if your classes are not balanced?
This is a general problem, and here are some ideas on how to deal with it: th-cam.com/video/iTxzRVLoTQ0/w-d-xo.html
@@statquest Awesome thanks!
Hey, great video, thanks!
What happens after the transformation though? I mean, how does the final result. i.e. a scalar corresponding to relationship between each observation, help in identifying an optimally classifying hyperplane?
The value is used in a way similar to how loss values are used in Gradient Descent. There is an iterative algorithm that uses the values to optimize the fit.
In this example why r = 1/2 and d =2 can you explain? I got what is r and d but why its 1/2 and 2 i didnot get.
Those are user defined parameters, which is why I also illustrate the effects of choosing alternative values at 3:41. Typically you use cross validation to find the best values to use.
Great explanation ! But what are the math reasons to choose RBF Kernel or Polynomial Kernel ? It depends on what ?
Usually people just start with the RBF kernel and see how well it performs. If it doesn't do well, they might try to polynomial kernel.
So what do we do after we have the value for every green and red dot? Draw the hyperplane between the pair which had the maximum value (doesn't make a lot of sense though)?
SVMs use an iterative procedure to find a hyperplane that has the largest margin given the number allowed misclassifications.
@@statquest No, suppose we have 16002.25 after applying kernel for a=9 and b=14. Then what? How is the SVC made with a value of 16,000 for values of 9 and 14...for this current case (I understand that a lot of SVC will be made and checked before deciding upon the final SVC)
@@yashmishra12 Unfortunately, the answer to your question is way out of the scope of the space provided for comments. However, for more information that have all of the details, check out: www.cs.cmu.edu/~epxing/Class/10701-08s/recitation/svm.pdf
@@statquest Thanks
One suggestion: if at the beginning, if the all the topics are listed in a logical way, it would even better. Big thanks for the videos, really appreciate it 🙏
Thanks!
@@statquest thank you
Thanks for the videos 😊, Can we use SVM for multinomial classification?
I believe you just create one SVM per classification, and each SVM compares one classification to all the others (i.e. a sample either has that classification or not).
Sorry, why green dots are below red dots in 2D? If you compute dosage^2, green dots should be above the first few red dots, right?
What time in the video are you referring to?
What I understood the function of kernel is to transform the data into high dimension so that there exists a classifier in that dimension which seperates those points. Right?
If yes than why not just square each value instead of getting each pair to kernel function?
The kernel provides us with the high-dimensional relationships between points without actually doing the transformation. This is the "kernel trick" and it saves time and makes it possible to determine the relationships between points in infinite-dimensions (which is what the radial kernel does).
from where did you get values (9,14)
at 5:35
Those are the x-axis coordinates for those points and correspond to different dosages of a drug.
I didn't actually get where are these used, like I've read abt stuff you explained in the first video regarding SVM's.
Any supporting text you recommend that I should read to grasp this better...
Like I understood the formula, what is it for, what are the terms abrd and all that, but I feel something is missing
The idea of SVMs is to move the data into a higher dimension so that we can separate it with a support vector classifier. The Polynomial Kernel is one way to move the data into a higher dimension. For more details, see: th-cam.com/video/efR1C6CvhmE/w-d-xo.html Specifically - keep watching until the end because we'll touch on how the polynomial kernel works in that setting.
@@statquest Ooooo, so this (using the polynomial kernel) is a technique for finding out what dimension (parameter) is the best for which we can draw a hyperplane to separate different classes ?
Thanks for replying sir :)
@@newbie8051 Yep! That's the idea.
Great video thank you. But I don't understand why the kernel with dot product is more computationally efficient than transform the data in 2 dimension, because in any case we have to raise a and b, the observations (the data so), to the square, and that is transform the data in 2 dimensions no ? and then we do the dot product... So I'm missing sthg here but I can't see what. thank you very much !
I think in 2-d, it is not very efficient, but SVM can work in infinite dimensions, and I believe it is more efficient in that case.
@@statquest sorry my question was not really clear. What is data transformation exactly ? It s raising data/feature to the square ? If this is the case, why svm is more efficient whereas we still need to compute observarions/data to the square i.e a² and b² ? Again sorry if there is misunderstanding from myself i m new to maths and ML
@@geogeo14000 It's not that the transformation itself is inefficient, it's finding the optimal Support Vector Classifier. This is done using an iterative procedure that operates on just the dot products, rather than the distances in higher dimensions.
@@statquest ok thank you very much.
When you say relationships between observations, what exactly do you mean? You didn't really go over how such relationships allow you to find an SVC in the higher dimension?
In the case of SVM, the relationship is a rather abstract metric of distance.
How do you transform 2D data to 3D? How will you get the Z-coordinate?
If you remember how we moved from 1-D to 2-D (at 2:54)...then if you start with 2-D data then 'a' and 'b' are 2-D vectors. Now set r=1/2 and d=2 and you will get the original 2-D vectors, plus the values in the 2-D vectors, squared. So this will move you from 2-D to 4-D. So I'm not sure you can go from 2-D to 3-D directly.
@@statquest Okay, thanks for the fast reply!
In a nutshell, why do you need to calculate dot product or does it require a separate video?
That would be a whole different video.
What does the result of the dot product mean when it represents the relationship of two dots?
It's the input to an iterative algorithm, much like gradient descent, that can find the optimal classifier.
What exactly is meant by relationships between observations?
It's some metric of distance.
One doubt, though u multiple a and b by sqrt2, shouldn't u calculate a^2 and b^2 using original a and b rather than sqrt2*a and sqrt2*b on y-axis?
Yes, and that is what is done in the video. We use the original a and b values to calculate the y-axis coordinates. However, the x-axis values are still the sqrt(2)*a and sqrt(2)*b, so the values have coordinates (sqrt(2)*a) , a^2)
@@statquest Awesome!
Can anyone explain to me how the dot products of the feature vectors can find the separating hyperplane?
First, think of a dot product as a type of measure of similarity (the larger the absolute value, the more similar) and that similarity can be a proxy for closeness. Then those measures are plugged into an iterative algorithm, somewhat like gradient descent (see: th-cam.com/video/sDv4f4s2SB8/w-d-xo.html ), to find the optimal classifier.
I didn't get how the kernel relationship value is used to transform the data. In the theory, the kernel relationship is a square matrix, containing kernel values for all samples 2 by 2. You calculated one of these at the end, but how to use them to transfer the initial data? what is the function or algorithm?
Explaining how the kernel values are used would require a bunch more videos. However, the quick and easy version is that it uses an iterative algorithm that is similar (but not the same) as gradient descent to find the optimal classifier.
@@statquest Thanks a lot. You have shown a manual transformation in 3:30. My question is what are 'a' and 'b'? any pair of samples regardless of their labels? if so, how it works when a=x1 is used in different dot products (first with b=x2 and then with b=x4)? I hope I could clarify my point
@@hamedbahramiyan If a=x1, then it's 2-D coordinates will be a, a^2, regardless of what b is set to.
@@statquest thank you
Hello at 6.04 you said why is it a dot product is beyond the scope of this video.. can you help me materials which can help me go through it to find out why it's a dot product and not a cross product? maybe a book will do.
Thanks
Just google "support vector machine optimization"
please make a video on this 5:58
It's on the to-do list.
could you please provide an example where 3d data is converted to 4d data using polynomial kernel? I am stuck
It's very difficult to draw something in 4-dimensions.
@@statquest okay. How about 2d to 3d?
Thanks for the amazing video. Please, if I have 100 samples for training and each with 5 features and try to apply 2D polynomial. So how my data is converted to a higher dimension? in other words what do we mean by the two input vectors in the polynomial equation?
In this case, the vectors for each point, a and b, contain values for all 5 features and the arithmetic shown in the video is applied to the values for all 5 features.
@@statquest Thanks Dr Josh. Actually, my question is about how to choose the vectors themselves? As I understand from your video, I guessed that the relationship is taken of each point with all others, so the the resulted points are higher in number than the previous! And the features dimensions are already enlarged! Am I right?
@@vianadnanferman9752 Forgive me if I'm just repeating what you wrote, but we calculate all of the different relationships between all of the points. The process of calculating the relationships gives us the features in the higher dimensional space.