Likelihood | Log likelihood | Sufficiency | Multiple parameters

ฝัง
- เผยแพร่เมื่อ 25 มิ.ย. 2024
- See all my videos here: www.zstatistics.com/
***************************************************************
0:00 Introduction
2:17 Example 1 (Discrete distribution: develop your intuition!)
7:25 Likelihood
8:52 Likelihood ratio
10:00 Likelihood function
11:05 Log likelihood function
14:41 Sufficient statistics
16:30 Example 2 (Continuous distribution)
20:53 Multiple parameters
26:11 Nuisance parameters
***************************************************************
I would definitely advise watching the video from the beginning here as Example 1 is referred to throughout!


I am currently in grad school for statistics and am taking a Mathematical Statistics course, and you explain things literally 100X better than my professor. Thank you.
Some of the best youtube lectures I have watched so far!
When i first saw ur picture while scrolling down my search, i thought wht is this young guy gonna teach. He looks my age n all u were the last one i opted to watch but after seeing this video i am truly stunned. U r like a Handsome Hulk of Statistics. Thank you!
Finally. The likelihood jargon started sinking in. Just because of you and your simple explanation. You are giving an amazing contribution to this space. Thank you from India ❤
The lecturer at one of my university statistics courses really doesn't know how to teach. You are a savior, thank you so much
Are we from the same university:D
The clarity you bring to the concept of MLE- you deserve a medal of honour!!
Brilliant! All the other videos were full of jargon. This is the only one with a bottom up approach. great job!
This video really removed the confusion about likelihood and mostly profile likelihood.....An instructor like you should be in all teaching platforms....Thanks for clearing our doubts.
These lecture videos really fills the gaps from the book my professor is using, Statistical Inference 2nd Edition by Casella. Thanks!
Casella Berger is the most difficult textbook I've ever encountered
I have been reading around for hours - thick textbook and academic papers and his video about likelihood beat them all? Awesome!
Not sure why it took me so long to find your channel, but I'm sure you're saving so many people in stat classes. Statistics can be so counter-intuitive and when I first started learning it I found the notation to be almost nonsense, thetas and sigmas left and right, bars and hats all over the place. These videos are incredibly efficient at teaching things from the ground up and building up an intuition over what is actually going on, which is something I've found my lecturers being unable to do, at least not good enough for me to comprehend everything. Thank you, I'm sure you're saving the lives of thousands of students all over the world with this, which is kind of ironic since it's technically the universities and schools that are suppose to teach, but God bless youtube content creators :^)
This is the kind of content I would rather pay for.
Presentation Game: 10/10
Clarity and Brevity: 10/10
Content Quality: 20/10
And yes nothing subjective here.
This channel is gonna be on my top recommendation list when it comes to all things DS/Stats. Thanks!!
You are better than the professors I had in appplied statistics graduate school. Keep up the goodwork.
Mate, not even finished the video. I'm barely at minute 07, and you already deserved my like. It's unbelievable your efforts to make any complex idea in something really pleasant to understand. Many thanks for that!
Greetings from Brazil!
Those vedios saved my college degree. I learned much more than my whole semester.
I'm currently a grad student in applied stats, and likelihood & log likelihood was presented to me w/ no context or explanation of what it is or how it's used, just an equation. The concept keeps popping up in my notes, so I've been struggling to understand it. Your video has really helped clarify things for me. Thanks!
Great presentation! You make statistics come alive!
Very helpful. Thank you so much!
So nice to see new videos. You are the best!
This is amazingly helpful. Thank you so much.
Over and over,I continued to feel that youtube teachers serves me better than the professors in my university.
Excellent! Many thanks!
Thank you so much for making these videos! I can't tell you how much I appreciate you and others like you who have put so much time and thought into creating material that is accessible and helpful for those of us who are struggling through stats and other math classes.
THIS IS LITERALLY SO AMAZING
best statistics videos on internet!
Thank you for your clearly explained video! Keep up the great work.! 十分谢谢!再接再厉!
This video is incredibly clear and well done! Saving me!
Exceptionally clear explanation!
Thank you for sharing this amazing video on TH-cam, The flow of your slides and the use of examples to further elaborate the concept you explained is really helpful.
you are the best bro!!! you're saving a brazilian student
This was a very helpful video! Thank you.
The best professor on TH-cam ever
An amazing explanation! One of the clearest and best examples selected to demonstrate the suitable concepts. Thanks a lot!
Thanks for your time and efforts to put these videos!
This is a great video! Thank you so much!
This was very useful, thank you.
you introduced me to the art of statistics sir ! thank you :)
Wow - Thank you so much for this amazing video!
great video!
saved my life thx
great video! thank you so much!
Hi there, i'm a Grad student and found this really helpful. Thank you from the Philippines!
Thank you very much for this clearly explained content. The examples allowed me to clearly understand several concepts. The graphical representation also allowed me to understand the role of the different parameters. THANKS
Thank you so much
Thank you for great video materials.
I understand the SAS output with the different goodness of fit statistics now so much better. What is likelihood ratio and profile likelihood? Thanks a lot for creating these videos.
Thank you very much
Great lecture
Take my Respect.
you are amazing!
at 8:25 you introduced continuous distribution. However you did not connect it the probability logic being flipped for likelihood. The way you did it for discrete case.
The challenging part for continuous case is you can't any more give the logic of probability being flipped.
Really needed your help here.
Superb content !
Hi zed,
quick question: At 8:33 you talk about the "PDF in the discrete case". Did you mean the mass function, or am I just misunderstanding what you mean with a discrete distribution here?
Either way, thank you so much for your videos!
OMG THAAAAAANK YOU!
genius presentation
What's the slides template you're using? It's beautiful.
Amazing. Far beyond the expectation for a youtube lecture. Thank you so much
If I'm unsure whether my data points are better described by distribution A or B, can I compare the maximum likelihood of distribution A and B and pick the highest one or likelihood of different distributions shouldn't be compared?
14:11 about the "junk material" has me so confused. Isn't C of theta just a function? Where did log(^n*C_y) come from? Awesome videos!
Thanks!
Back at you, JP!
Mr. Justin Z: Example 2 Video 18,28 how did you get to that formula WITHOUT the Euler e's? Thank you.
In the definition of likelihood, you say we use the pdf for a continuous distribution. But I have read that a likelihood function is not a pdf because it does not have area 1? Which is right?
Or is a likelihood function only a pdf if there is 1 parameter?
Thank you so much for the video. I dont understand the formula of Likelihood at minute 10:51. Why technically, in a sample of size n, this likelihood takes the form of a product. Please explain to me. Thank you so much!
@6:48 hanging on every word, i was about to complete the flip to an deep understanding of likelihood.... but you used the term PDF (probability density function) .... as you said this, I encountered some 'semantic turbulence' as I interpret the binomial probabilities as part of a PMF (probability mass function)... but this is, trivial... it's just that statisticians have a way of being very specific... in this case 'PMF' distinguishes discrete probabilities (eg binomial) from 'PDF' continuous probabilities (eg normal)... thus a binomial distribution is not a PDF, its a PMF.... we should say 'probability distribution' to be general, not PDF or PMF... so yes I completed the flip! I understand likelihoods now ! Thanks!
@8:27 you clarified that you are using the term PDF to refer to both (since its a trivial difference, and I agree).... sorry for the rant.
1) Can you make a video explaining linear model,annova model,matrix model of experimental design (especially CRD,....etc.)explanations and casual derivations if possible
2. Can you make vidios on augmented designs..
best!
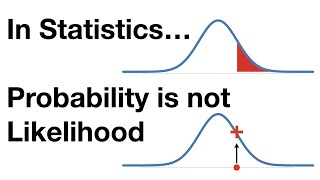
06:15 "A function that provide, for a fixed sample outcome, a distribution likelihood of the population parameter theta"
07:34 "Likelihood describes/quantifies the extent to which the SAMPLE provide support for any particular PROBABLY PARAMETER value."
For discretion prob function:
L(θο|y) = Pr(Y=y|θ=θο) = f(y|θο)
For continuous prob function:
L(θο|y) = f(y|θο)
Likelihood Ratio
= L(θ0|y) / L(θ1|y)
For a set of data,
Likelihood = L(y1) * L(y2) * ... * L(yn)
Is theta (parameter of a distribution) a Random Variable here (as in Bayesian framework)?
brilliant
But you still need individual vales of y as there is a term yi^2?
Hi great video as always.
However I still don't understand why the likelihood function is a series of products instead of being a series of summations.
My argument is that the Likelihood of obtaining a required value for theta basically entails the likelihood of obtaining theta given a1 individuals are taken from the sample OR a2 individuals are taken from the sample and so on
The product implies that the likelihood of obtaining a required value for theta equals the likelihood of obtaining theta given a1 AND the likelihood of obtaining theta given a2 and so on...
Thank you for the great videos!
Interestingly, in your example in the beginning of the video (with prevalence of thalasemia) for both cases the probability of second smaller value is quite close to the actual value probability (i.e. in the case of 7%, the probability of having 6 people out of 100 with thalasemia is quite close to the probability of having 7 people out of 100, similar for 8% case), however it decreases with higher values (i.e. the probability of having 8 people out of 100 is smaller than the peobability of having 6 people out of 100 for 7% case and again the same happens in 8% case also).
Is it just by chance or there is some specific reason why the values which are the nearest to our expected value have such different probability?
Astute observation! You have uncovered the tyranny of counting numbers. If I told you that the average age of a child when they first get braces is 13.0 (as in ON their 13th birthday) then you'll similarly find the sampling distribution is higher at 12 than at 14. Why? Well where is the mean?? It is on the LEFT HAND SIDE of the bar that represents 13 year olds. You could even say it is on the RIGHT HAND SIDE of the bar representing 12 year olds.
The same is happening here. Theta is 0.07 exactly. (as in, 0.07000000...) If you drew a vertical line to represent the mean on your sampling distribution (irrespective of n), it would lie on the left side of the bar representing 7% (ie. The bar representing 7/100).
If the popn proportion was 0.075 then you would find that the bar for 6 ( where n= 100) would be a similar height to the bar for 8.
I'm actually now doubting my reply above! This is a really good question Roman that has had me stumped for the last half an hour. Sample outcomes are not counting numbers (like my age example above), but rather discrete rounded figures of a latent continuous variable. So my example in my previous reply is wrong.
I think it more has to do with the fact that the sampling distribution will necessarily be right skewed (think about a sample of size 5 from a population where theta = 0.07. The highest bar will be at 0/5, and it will quickly slope down to the right. SO! Given that we have a sample whose distribution will be right skewed, that implies mode < mean. So the mode will be slightly to the left of the mean of the distribution. That's a better answer (albeit inductive rather than deductive)!
Hope I haven't confused!
Its a great question though!
thank you! so if we had a sample with normal distribution the probabilitieswould have been roughly the same?
@@romanteplov9227 you don't necessarily need the sample to be taken from a normal distribution, but so long as the sampling distribution is symmetrical then mean= mode, and the distribution will fall away evenly on both sides
So, for example, if theta=0.5.
Hello there! Great content! I was wondering which technology you used to create this beautiful presentaion. Cheers!
I use prezi for the presentation and then camtasia to record :)
@@zedstatistics great thank you! Keep it up!
@12:11 why do you keep theta in braces ?? it suggests ^nC_y being a function whose argument is theta.
What s the meaning of C in likelihood function?
at 19:02 you have (1/200*pi)^5/2 where did this 5/2 come from?
At 20:00 why do you only substitute T(y) for sigma y and not sigma y^2/200 ?
He says it in around 20:40. Sigma y^2 is free from mu, the parameter of interest WHILE sigma y is not free from mu; however, all you need is sigma y to gain knowledge of mu. Hence, the sufficient statistic. I hope I accurately explained this.
Is that possible for you to attach your excel file,where you showed the plots at 25.20 and 28, here , that would be so helpfull for teaching and learning to play on it. Without your sample data input, it'll be waste of time to try to get similar plot. Your Y axis scale (x10^-9) doesn't seem quite right when I do the same calculation. It's way smaller likelihood. Best regards.
I want to know if the graphs for the first example are based on the real data, because I am trying to replicate the graphs. Would be super helpful if you can show us the R code to do the graphs. Thank you for all you do!
I tried to graph it, but the combination term is too big c(100,6). So I just plotted with the changing parts of the likelihood function. How do I plot what you had here. Thanks !
10:57
Likelihood function, L(θ)= prod_of [f_i (y_i;θ)]
Should the PDF f have a subscript of i? Or it's a mistake?
I was wondering the same thing. But now I think it is a typo. The function should be determined by all values of y, which are fixed, since that is where we are evaluating the likelihood of getting that set of y given theta (the variable).
20:08 why - mu^2? shouldn't it be +? and why is nu in equation now?? is nu to be =5?
Dumb question alert: how did you get L-theta values= 0.153 and 0.123 in the example? I thought the | indicating "given that" requires multiplication of independent events (hypothesis | evidence), so in this case L ( 0.07 | 0.06 ) = 0.0042 and L ( 0.08 | 0.06 ) = 0.0048 ? Feel free to explain me this anyone!Thanks
💜
for videos like this one I just wish youtube allowed me to speed it up to 16x instead of just 2x
13:30 Shouldn't it be -94log(1-θ1), instead of +94log(1-θ1)?
great video but it gets confusing at the end.
Statistical inference maths and stochastic process maths are my nightmares...
gauss bless you
oh wordddddd
Hi I admire your knowledge but in 28:23 when u show the likelihood formulate your explanation was wrong about product the fact is likelihood for one y is not a product, the likelihood when we have a Y that consists of y1,y2,...,yn then the formulate becomes a product of likelihood of all these ys please correct it
I cannot plot it in wolframalpaha
i though theta was unknowable???????????someone pls explain
Nice video. I don't agree with you that likelihood by itself has no meaning, because that would imply that all pdf values by themselves have no meaning. Sure, the ratio is also informative, but by themselves likelihood informs you of the probability density value given the choice of your parameters for the given sample.
You also fail to mention that the product formula for likelihood is a direct result of the samples being independent. This formula thus assumes independent samples. If your samples turm out to be dependent then you cannot simplify the joint pdf into a product of univariate pdfs, which is what the product formula is.
profound
look likelyhood parameter.
Mistake at 10 min?? where says .152/.123 = 1.124? Should be this = 1.235??
I am watching only bcoz Justin Zeltzer made this video. His regression videos simply impressed me.
But I have to admit, Statistics subject and I do not go well. I think Statistics is full of nonsense! Have you seen in drama where lovers take a rose and peel of petals one at a time, saying: 'She loves me' and in next petal 'She loves me not', and rely on the last petal as the likelihood of their love. Statisticians do the same thing by playing with equations which no-one truly understands!
Statistics/Stochastic is an imperfect field. Those equations are merely to torture learners.
At the end of all that learning what you have is likelihood, probability and distributions which do not give exact result.
If nature followed it, you wouldn't exist. It takes only one sperm to meet the egg and create baby. But a million sperms are in the race to reach the egg. So the probability of a baby being created is 1 in a million. Does this mean you take the risk of not using a condom?
Please don't do that. In nature, even 1 entity has power to do magic or tragic.
what are you?Socrates..you are inverse socrates..Good point
Learning stats is like learning the martian language when you've been held captive in a jail on their planet. Sure, their language is only being used for nefarious purposes- but don't you want to know what the wardens are saying??
In other words: learning stats inoculates you from being fooled by statisticians. Or martian jailors. Or something.
@@zedstatistics you are a good statistician to learn from. I watch your videos.
But why is this notion of sufficient useful? What does it provide us to know that a statistic doesn’t depend on parameters? Is it too complex to fit in one video I guess.
Lol”formuli”? Is that actually the plural ?
@20:10 doing the math... why does 100 appear in the denominator after expansion?, shouldn't it be 200 like the other denominators? I think its a typo... it would be better to factor out the 200 earlier to help make your point about not needing the fixed parts (dependent on standard dev).
wait I get it! .. the 100 in the denominator is correct since the middle of a polynomial term (a-b)^2 is 2ab and 2ab/200 would give 100 in the denominator!
holy shit this video made a whole bunch of things click