TH-cam
US
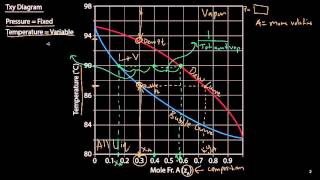
Txy and Pxy Diagrams
14:53
Azeotropes
12:07
Wet Bulb vs Dew Point Temperature
9:36
#เดอะตุ๊ก !! เจาะเดือด ทีมชาติ ผ่าฟอร์ม !! ทีมชาติไทย มันส์ เปิด สาเหตุ !! ระบบ+แท็คติก
20:27
ซินเดอเรลล่ากลายเป็นภรรยาของลุงสุดหล่อหลังจากคืนโรแมนติกนั้น ไม่รู้ว่าเธอได้พบกับมหาเศรษฐี
1:32:40
ช้างศึกโดนก่อน ไล่ยิงคืนสิงคโปร์ ทะลุน็อคเอาท์
55:01
Phase diagrams of binary solutions: dew point and bubble point
Bloom Training & Consulting
ติดตาม
262
ดาวน์โหลด
โหลดลิงค์.....
มุมมอง 32 355
0
0
เพิ่มลงใน
เพลย์ลิสต์ของฉัน
ดูภายหลัง
แชร์
แชร์
ฝัง
ขนาดวิดีโอ:
1280 X 720
853 X 480
640 X 360
แสดงแผงควบคุมโปรแกรมเล่น
เล่นอัตโนมัติ
เล่นใหม่
เผยแพร่เมื่อ 22 ม.ค. 2025
ความคิดเห็น • 30
ต่อไป
เล่นอัตโนมัติ
14:53
Txy and Pxy Diagrams
Michael Hoepfner
มุมมอง 92K
12:07
Azeotropes
Physical Chemistry
มุมมอง 54K
9:36
Wet Bulb vs Dew Point Temperature
Process with Pat
มุมมอง 41K
20:27
#เดอะตุ๊ก !! เจาะเดือด ทีมชาติ ผ่าฟอร์ม !! ทีมชาติไทย มันส์ เปิด สาเหตุ !! ระบบ+แท็คติก
แตงโมลง ปิยะพงษ์ยิง
มุมมอง 291K
1:32:40
ซินเดอเรลล่ากลายเป็นภรรยาของลุงสุดหล่อหลังจากคืนโรแมนติกนั้น ไม่รู้ว่าเธอได้พบกับมหาเศรษฐี
Shop ละคร
มุมมอง 1.4M
55:01
ช้างศึกโดนก่อน ไล่ยิงคืนสิงคโปร์ ทะลุน็อคเอาท์
ฟุตบอล108
มุมมอง 101K
1:23:46
【หนังพากย์ไทย】ยอดฝีมือสังหารนักโทษ แต่นักโทษเป็นปรมาจารย์กังฟูที่ซ่อนอยู่ เขาจัดการทั้งหมดในทันที
Fresh Thailand
มุมมอง 468K
7:15
Binary Phase Diagrams Explained
ChemSurvival
มุมมอง 67K
8:30
Solving VLE Using Raoult's Law and Iterative Method Solver
LearnChemE
มุมมอง 57K
21:20
Binary V-L equilibrium diagrams
CHE 350
มุมมอง 32K
9:20
Dew and Bubble Points/Curves
Michael Hoepfner
มุมมอง 10K
7:27
Azeotropes (Introduction)
Physical Chemistry
มุมมอง 18K
14:26
Bubble Point, Dew Point, Phase Diagram in HYSYS
eduX
มุมมอง 22K
11:51
Liquid-Liquid Phase Diagrams
Hagen@Cal Poly
มุมมอง 12K
10:07
Binary Phase Diagram (Txy and xy)
LearnChemE
มุมมอง 150K
16:42
Muddiest Point- Phase Diagrams I: Eutectic Calculations and Lever Rule
MaterialsConcepts
มุมมอง 974K
1:12:27
คริสต์มาสมรณะ | Who Are You EP.7 ( Edwin )
Ananped
มุมมอง 1.2M
00:28
Players vs Trophies 🤯
LE FOOT EN VIDÉO
มุมมอง 9M
4:08:46
Live!🔴 สิงคโปร์ VS ทีมชาติไทย เชียร์สดฟุตบอลฟุตบอล ASEAN Mitsubishi Electric Cup™ 2024
Thairath Sport
มุมมอง 555K
00:26
Cool Items!🥰 New Gadgets, Smart Appliances, Kitchen Tools Utensils, Home Cleaning, Beauty #shorts
Cool Items Official
มุมมอง 8M
21:52
#นายกแพทองธาร ลงพื้นที่มอบถุงยังชีพ บริเวณ ซ.พัฒนาการคูขวาง ๑๐ (ถ.ท่าโพธิ์) จ.นครศรีธรรมราช
VOICE TV
มุมมอง 119K
00:22
New Colour Match Puzzle Challenge with Cola and McDonald’s Avengers Logo - Incredibox Sprunki
FlowerTeam
มุมมอง 3.8M
2:33:50
🔴LIVE กัมพูชา vs ติมอร์-เลสเต | ฟุตบอล ASEAN Mitsubishi Electric Cup™ 2024 | รอบแรก กลุ่ม A
Thairath Sport
มุมมอง 488K
2:03:50
ศึกมวยไทยพันธมิตร 16/12/2024
True4U
มุมมอง 71K