
ฝัง
- เผยแพร่เมื่อ 25 พ.ค. 2020
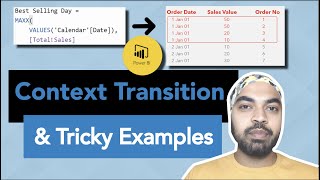
- Learn how the DAX EARLIER function works in Power BI.
Download Files and Blog - www.goodly.co.in/earlier-func...
- - - - My Courses - - - -
✔️ Mastering DAX in Power BI -
goodly.co.in/learn-dax-powerbi/
✔️ Power Query Course-
goodly.co.in/learn-power-query/
✔️ Master Excel Step by Step-
goodly.co.in/learn-excel/
✔️ Business Intelligence Dashboards-
goodly.co.in/learn-excel-dash...
- - - - Blog - - - -
www.goodly.co.in/blog - วิทยาศาสตร์และเทคโนโลยี


Easily the best explanation of EARLIER I have seen. Period.
Glad you found it helpful
These function videos are the absolute best my friend. Learned more in a couple of hours from you then weeks trying to read and understand from a book
One of the best videos I have seen that clearly explained the Earlier function
This is just amazing. I was scratching my head for past 1 week to understand this nested row context process. Thanks a lot.
Thanks Sankalp, Glad you liked it :)
This is a great explanation, helps to actually understand what is happening and how to perceive both contexts. I had a really hard time to do that with other videos.
Simplest explanation of earlier function on this planet.
This is one of the fabulous example I have came across in DAX. Epic explanation .👍
You exactly know how to explain things and make them seem simple. Thank Chandeep
Oh man, another level of explanation 👍🏻
Oh wow, I finally understand what Earlier does, thank you 🙏
Wow, I was struggling to understand the concept behind this, but your video was the most effective for me. Thank you so much for this detailed explanation.
This is a really good introduction to Earlier, also had a few spin offs, I first tried using a variable instead of Earlier, not as straight forward as I'd have thought, and then doing it in excel cross tab which I never quite got to work, had all the percentages, but getting the correct budget into each cell proved tricky.
Trying to figure out a problem for so so long and this video finally got me there! Thank you so much, it was a massive help :)
Great to hear!
Thanks alot brother!
It means alot to me
Excellent video. I definitely appreciate your style of explanation. This really helped me understand uses for the EARLIER function.
Glad it was helpful!
Incredible explanation..!!
Many thanks for this video
Explained Very well Thank you
Great explanation! Finnaly got the idea about EARLIER when gou compared it to COUNTIF! Thanks!
Glad it was helpful!
Awesome explanation.
superb explanation, would love to see more dax videos coming from you!
More to come!
Cheers
thank you very much !
Neat and clean explanation ! Thankyou for your efforts !
Thank you for your appreciation 😊
Best ever explanation. Please continue to add more videos.
More to come!
That's a great explanation!, thanks
Glad you like it 😊
Great Explanation !! could you also do a video on power bi API for power query. Thanks !!
Hello,
I appreciate the quality of your videos and commend you for the clarity of your explanations. I'm wondering if it's possible to apply the "Earlier" function in a DAX measure for calculating the cumulative total of revenue by product category, for instance.
Based on the example you provided using the "COUNTROWS" function, I couldn't figure out how to adapt it with the "SUMX" function to achieve cumulative total through a measure instead of a column. Thank you in advance for your response.
fantastic explanation
This is awesome
Awesome...your are a great teacher...please keep posting more videos
Thank you, I will
Thank you so much. My concept got cleared.
I would request you Pls tell me where i can get this data set. Not able to find download files and blog section.
What if I want to accumulate values (based on date) but separated for each value of the other column (for example column client contains client 1, 2 and 3). I'd want to accumulate it separately for each one, rather than together. Thanks!
superb
10:57 was the measure meant to allocate the exact same amount to every row of the same region? I mean let's say that there are 20 rows of Mumbai, and 1/20 = 5%. So the display should show every row of Mumbai gets 5% x 25000 = 1250, shouldn't it? Why then every row of Mumbai gets different budget allocation? Could you please explain more? Thank you
hi i have same question
Awesome 😎😎
Thanks!
Thanks
Thanks for the tip!
Hi Chandeep...nice video. Can you provide a short summary of the "iterator functions" in Power BI....many thanks.
See this - th-cam.com/video/4AQvu4kuSYc/w-d-xo.html
Hiii..pls help me to find a consecutive 3days product failure in a week.. if product got failed continuous 3 days in a week i need that result in True or false
Hi, Thank you for excellent explanation.
I am stuck in a similar problem..but my dates are not in hierachy.. my dates are like this
1. 22 Apr
2. 25 Apr
3. 4 May
Now,
min date : 22 Apr
Max date: 4 may
I have to find date prior to max date....i.e 25 Apr...
How to achieve this?
Pl share, if you have any solution for this problem
If want to escape empty value what to do
= COUNTROWS(FILTER(ProductSubcategory, EARLIER(ProductSubcategory[TotalSubcategorySales])
If that is a calculated column.
Calculated column produces a row context and FILTER produces the other.
If that is a measure, I doubt that is going to work.
@@GoodlyChandeep it's CC thankx!
Hello big request that you can share the dummy data with us to practice along with other information
Here is the file - goodly.co.in/?ebddl=4e8c699067
Tried this function and it only works with a small dataset. I ended up making the calculations in source data.
I don't understand, according to me every single product in a region should have equal budget allocation since we are doing budget /count of region occurances
it is little bit tricky , first example i can understand but second example is too much tough little bit tough can u explain it