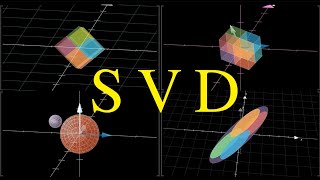
SVD: Image Compression [Matlab]

ฝัง
- เผยแพร่เมื่อ 27 ก.ย. 2024
- This video describes how to use the singular value decomposition (SVD) for image compression in Matlab.
Book Website: databookuw.com
Book PDF: databookuw.com/...
These lectures follow Chapter 1 from: "Data-Driven Science and Engineering: Machine Learning, Dynamical Systems, and Control" by Brunton and Kutz
Amazon: www.amazon.com...
Brunton Website: eigensteve.com
This video was produced at the University of Washington
![SVD: Image Compression [Python]](http://i.ytimg.com/vi/H7qMMudo3e8/mqdefault.jpg)
![SVD: Image Compression [Python]](/img/tr.png)


Absolutely amazing! This video series should be considered a "national treasure" and kept safe at the Congress Library. Congratulation Prof. Brunton and many thanks for you valuable work.
Thank you so much!!
Very very great lecture series. In my opinion, what humans/students need the most (water, air, food, and lecture series like this) should be available to all.
Sir you are simply the best. I have learned a lot from your lectures. You are simply becoming my role model in my phd program........... lots of love from kashmir ...........
Thank you so much for the very kind words!!
Excellent lecture series!!! This is really inspiring and probably the best lecture series ever. Totally transforming the way we look at SVD and its applications in real life. Thank you! for your efforts and passion to create such lovely teaching materials, including the other lecture series on machine learning, control systems, and data-driven dynamical models.
Excellent lectures. I was having trouble understanding SVD. This lecture helped me a lot.
Thank you very much for uploading.
Glad it was helpful!
I was trying to understand PCA and Googled this amazing series. Thanks, Dr. Brunton. Not only the contents and explanations are stunning, but also the technologies used in the lectures were fabulous. The only complaint is that sometimes I couldn't focus because I'm thinking that how could Dr. Brunton write reversely? What fancy technology he was using? :)
Simply spectacular your way of teaching....you are a great teacher, greetings from Perú, South America
thanks for positing these. Definitely buying your book!
11:22 What would also be great is too add here Frobenius norm error graph, and show it's decreasing.
Also I have a question about hidden watermarks you talked about: If I add a big enough watermark even to parts related to the last eigenvalue, wouldn't it change the whole SVD basis?
Btw, thank you, you're lectures are God's blessing on mankind. 👍
Professor Steve, why people use FFT or Wavalets instead of SVD? For which application is SVD approach better then other two?
Just to make sure I've understood this correctly, since you're performing the SVD for a single image, you're essentially seeing how well the "pixel columns" of the same image are correlated to each other, correct?
P.S. the idea of digital watermarking seems so simple yet so cool, this is amazing stuff!
He responded to another comment on this. th-cam.com/video/H7qMMudo3e8/w-d-xo.html&lc=UgybqQYO8S_PsQOrkvV4AaABAg.96mgj1_NYPW98T05U7uNgu
Amazing Steve. You have really helped me in understanding SVD application in Data Science. Thanks a lot. I really hope if you could have made your videos downloadable
I cannot wait for the next lecture .. Very informative .
With just 5 modes, you can get a "Ruff" estimate!
Always a pleasure to watch
Thanks!
Amazing talk
Super cool! Thank you so much Prof. Brunton.
Yes, good to know you are a fan of Terry Prachett as well
Great lectures
my highest of fives for you
Thanks for that point about hiding data in low modes of the SVD. Good to know in case I ever wanna send “in your face” encryption or something :)
Thank you for this great video. One remark on matlab syntax, X' is the complex conjugate and not the transpose. The syntax for the transpose is X.'
Interesting, I don't think I've ever seen the correct one then. Was this always the case?
Anyway, in this case we know it's real numbers only, so still correct. In the words of the documentation: "When no complex elements are present, A' produces the same result as A.'."
@@_J_A_G_ yes. it was always the case and for real numbers it doesn't matter
@@liorcohen4212 Addendum for future readers: Apparently complex conjugate was anyway the right thing to do. So code was right also for complex numbers and lecture was simplifying. This came up in later lecture. th-cam.com/video/46Hpy4FiGls/w-d-xo.html
I ran thru all this in Matlab, and am a little confused about one thing. In your on screen examples in other videos you refer to each column on X being an image of a different face....but in this example the entire Matrix X appears to be one image ( the dog). Is it just a different example, or am I misinterpreting? Thanks!
Can SVD also be used to extract an approximate analytical equation from a bunch of x,y,z data? For example x = age, y = amount of hours walked per day, z = weight of person. Say the equation we would want to extract from the data would be z = x^2 - 4*x/y?
very cool sir. u expert in math and how do you easily do transition between 2 different languages MATLAB & Python? It's more of memorizing syntax right?
Hi Steve, are you able to share with me your set up to record this video? Would like to do something similar for my lecturers. Thanks!
Superb explaination
While using command 'imagesc' I am getting different color image not the gray one
Thank you very much
Tq prof.
where can I get this complete code?
Check out the links at databookuw.com
Thank You
SVD Algoritham using Original Image Compression Make it Decompression Image
Poor quality Disadvantage
How did you get so good at writing backwards :)
I'm pretty sure they just mirror the video in post-production
nice
amazing....do you have email or twitter?
on twitter @eigensteve
holy shit dude
awwww.... I thought we were *actually* going to compute the SVD... not just call "svd". Seems like a cop-out Mr. ;)
7:19 boopin' the low rank snoot
I'm learning Recommender Systems, so I came across the concept of SVD and searched for a video to better understand it. I couldn't be happier to find this amazing series, which has been most helpful and very enriching. Thank you so much, prof., regards from Brazil :)
Wow not only he provides us with brilliant lessons, he even shares his book in PDF form
thank you for your video and PDF books. Data science is now everywhere. Your video and the book alongside are my ongoing resources to visit, when I need a certain mathematic technique. I work for wind power section as a structural/mechanic engineer (of course a math lover). For the topics of Load Simulation, various of vibration and aerodynamics such as turbulence are the ones I am working on daily. Cheers,
Steve (and co.) I am a huge fan. You've deepened my appreciation of linear algebra, data science, fluid mechanics and matlab itself. Thank you! I recently purchased your book and I haul it around with me to school like it's one of the dead sea scrolls. I'm trying to better understand this idea of cumulative energy...can it be thought of as the 'effective power' of the rank of our sigma matrix? In this video with the image of your dog it appears that we approach the energy of rank 1 as we include more information, right? Am I understanding these nuances correctly? Thanks again for all of these videos. The clarity, passion and enthusiasm you have for these subjects is inspiring!
Thanks for the kind words and great question. We actually just finished up a 2nd edition, and realized that the discussion of cumulative energy needed to be cleared up. So your confusion is probably because it was a bit confusing... Technically, the cumulative energy would be computed by adding up the sum of the *squares* of the singular values, although most of the time we just add up the sum of singular values. Not a huge difference, but important to make units match up. And in that case, the spectrum does have a similar interpretation as *power* in the power spectral density with the Fourier transform. And yes indeed, this should all approach a normalized sum of 1 when we have all of the modes included. I will do my best to start posting errata soon to clarify some of these points. Usually would be posted on databookuw.com (and you can find the pdf at databookuw.com/databook.pdf ... not updated yet, but soon)
@@Eigensteve Wow, thank you for taking the time to answer my question! I must admit, I think there are a range of topics I need to delve further into to support my understanding of some of these concepts, but your response gives me a great point of departure for developing my intuition about this type of analysis. I guess I'm also asking too because, as I learn more, and watch more of these videos, I am trying to file away the sort of "magical" bits of knowledge as well as the sort of immediately "practical" bits (i.e "always graph the semilogy values of..")...not that the practical is any less magical...
Dr. Brunton, thanks very much for your excellent lectures!
Thanks a lot for all this @Steve_Brunton
You are very welcome
Link to the website:
databookuw.com/
Really really grateful to you for helping me learn this!
Thank you
Thanks for these amazing lectures!
You're very welcome!
Wonderful way of presentation!
Thank you for your amazing contribution!
Best explanation!!!!Amazing...
Thank you so much for an amazing presentation!!
Hi, Dr. Brunton, I got a question from a student on the POD mode energy that made me look again at this lecture. In your book and in your lecture, you suggest that the total energy is given by sum(diag(S)) and that the energy of each eigenmode is given by the eigenvalues diag(S). I feel like it should be given by diag(S²), though.
In my understanding, energy should reflect the variance of the snapshots, which is contained in the terms of the correlation matrix X X*. The diagonal terms of X X* are directly the variance of each data series. X X*, however, as you show in equation 1.7a, is U S² U*. Since U are unitary matrices, the energy contribution must come from S². This is in conflict with the code you present, where energy is given in terms of S. Am I mistaken in my understanding of POD?
I know plotting diag(S) gives you a good proxy for mode energy, but in many applications (like acoustics, for example) the correct energy metric is crucial. So I really would like to get this right!
I'd like to add that if you attempt to do this on a random noise matrix, for example, you do get the correct metric when squaring S. Try this in Matlab:
clear; clc; close all;
X=2*randn(10000,100); %Generates random noise with variance = 4. Rectangular matrix assures we'll not mess up the row/columns. Variance 4 assures squaring changes the outcome w.r.t. not squaring
[U,S,V]=svd(X,'econ'); %Regular SVD
X_energy_indiv=diag(X*X'); %x1.*x1 is the energy of the first pixel, for example. For 10000x100, We get 10000 entries averaging 400 each. Dividing by the number of snapshots (400/100=4) we get the variance
X_energy_total=sum(X_energy_indiv); %sum of the energies of each snapshot gives total energy. Should give about 10000*400=4e6
S_energy_nonsquared=sum(diag(S)); %should give about 2e4
S_energy_squared=sum(diag(S).^2); %should give exactly X_energy_total (4e6) (I think this is correct)
@@fzigunov Wondering the same, but the good news is, plotting on a log scale shouldn't really change the shape of the curves, just the units up to a constant factor
at least I hope so!
The cumulative plot might not have the right shape, and we depend on the percentage thresholds so I am a bit confused about that one
@@arminth4117 The problem is that it is very common for people to quote something like "modes 1 to M contain X% of the total energy" or "mode M contains X% of the energy in the flow". Therefore, the energy metric matters quite a bit.
About the plot shape; I think it is quite a secondary feature when analyzing POD results. The whole point of POD is to provide a more understandable description of what a complex system is fundamentally doing, so the shape only matters to give you a sense that the higher order modes can indeed be discarded (or not).
In the MATLAB implementation, the dog looks grainy for low ranks. But, when I check the memory size of the grainy dog using the 'whos' command, surprisingly the grainy dog occupies as much memory in bytes as the original HD dog. we are doing all the hard work to reduce the memory size, aren't we?
can you explain this prof?
Both original and reconstucted image are 2000x1500 pixels. This is (nx*ny) in both cases, so not where to look to save storage.
The compression idea is to look at the right side of the equation and instead store the U,S,V matrices. The "recipient" would from those do the work to reconstruct Xapprox after loading the data.
When discarding parts of those matrices (to keep only r columns of U and r rows of V) you get a lossy compression. The smaller r, the less data to store, but also a less accurate reconstruction. The key insight is that the vectors are already ordered by importance, so it's easy to include only as many as you need.
The "title" calculation has r*(nx+ny) for the stored data size. I think (as he indicated verbally) it should be r*(nx+1+ny) to also include the S matrix (S is diagonal, so the r-by-r matrix is zeroes everywhere but the diagonal, so I agree that it's a very small correction).
If the r=nx from the economy SVD transform, storing the U,S,V directly is no win, but as shown in the video r can be lowered quite a lot without visible degradation or even more if that is acceptable.
PS. IMHO, this video is mainly part of the intro for SVD, explaining the concept of rank reduction. It's not a literal "how to compress images" tutorial.
Hi Prof Steve, may I ask a question please: the compressed picture "Xapprox" has the same dimension as the original picture X. So why you said that the compression save storage?
See discussion in other comment: th-cam.com/video/QQ8vxj-9OfQ/w-d-xo.html&lc=UgySxL8I3zJqiqPtUlt4AaABAg.9Owk8AGSt769ijFmwq9Vli
Dr. Brunton, ty for these videos. I'll finish all the lectures before diving into the book.
One question, though. In previous videos you mentioned that the U matrix was composed by several columns which are the information of several images. Here, you applied the SVD to a single image and I don't understand how is that SVD can be applied to a single images which can be approximated by an U matrix with a single column.
I would be really thankful if you could explain this to me.
Thanks in advance!
He responded to another comment on this. th-cam.com/video/H7qMMudo3e8/w-d-xo.html&lc=UgybqQYO8S_PsQOrkvV4AaABAg.96mgj1_NYPW98T05U7uNgu
@@_J_A_G_ ty mate!